Categories
Uncategorized

Week 42

Jakub

Topic:
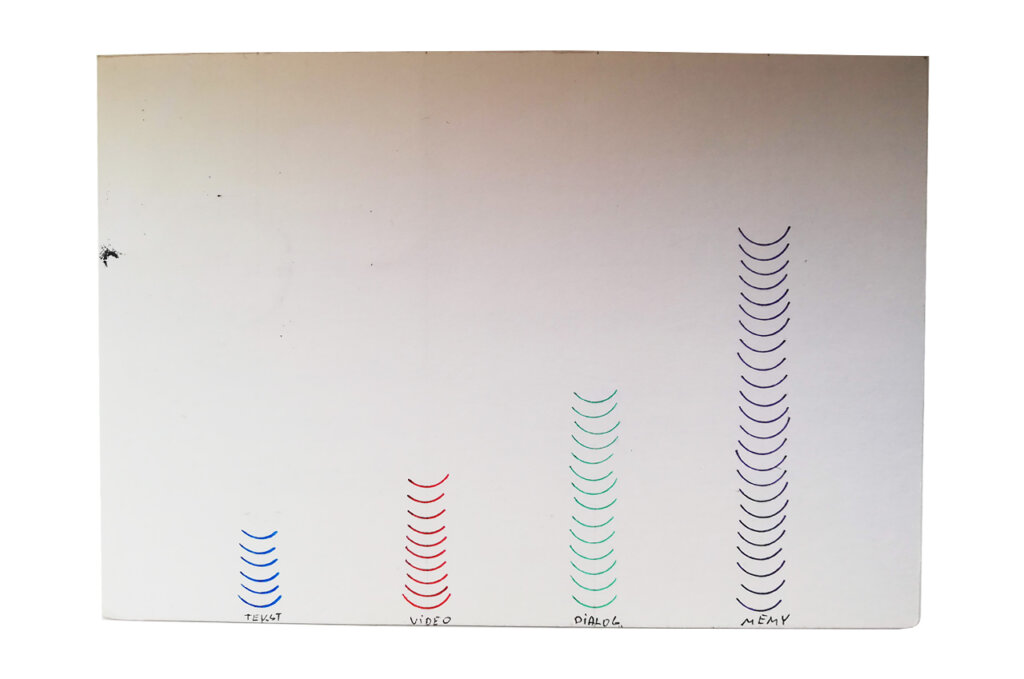
I think I have a lot of laughter in my life. Well… I’m addicted to it. I enjoy the human creativity in memes. I am a big fan of memes. 

I try to approach life with a healthy distance and optimism. My sense of humor in conversations with others often provokes bursts of laughter. This week’s data proves it.

Data gathering:
Throughout the week, I recorded the amount and sources of “laughs”. I only counted the ones after which I immediately remembered that I had to write them down. I think I could have missed at most 10% of “laughs”.

Data drawing:
Unfortunately, I didn’t have time to experiment this week, so I went for a simple bar chart.

Klaudia’s postcard:

It is interesting that we were both examining the sources of laughter. I must admit that Klaudia’s postcard presents the data more efficiently. I can maybe find one drawback: the categories are not sorted from largest to smallest.

The process:


Klaudia

Topic:
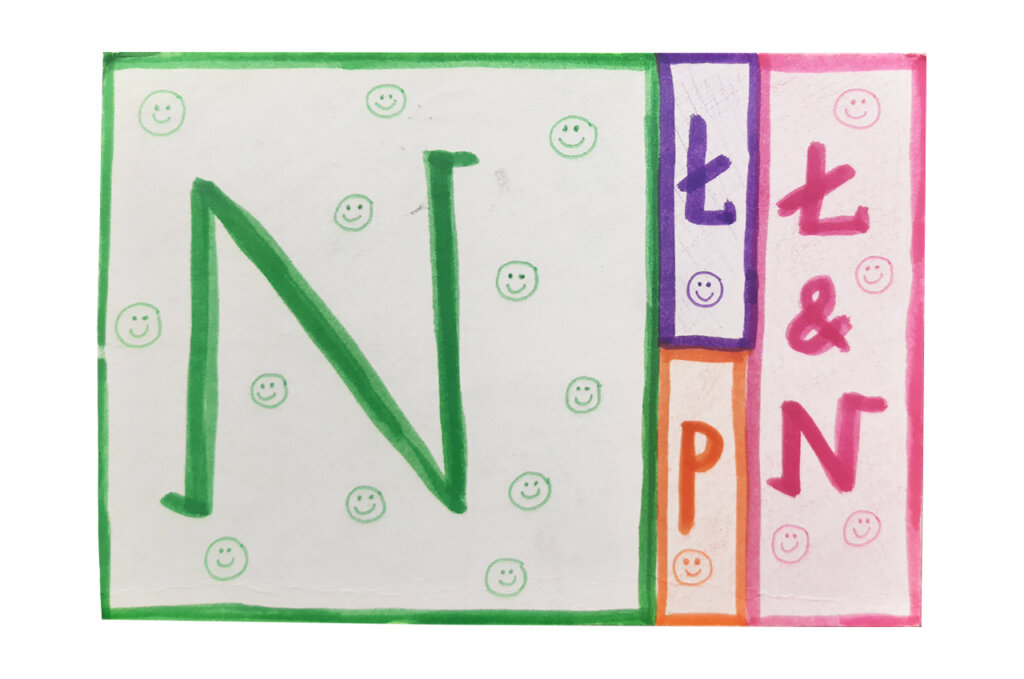
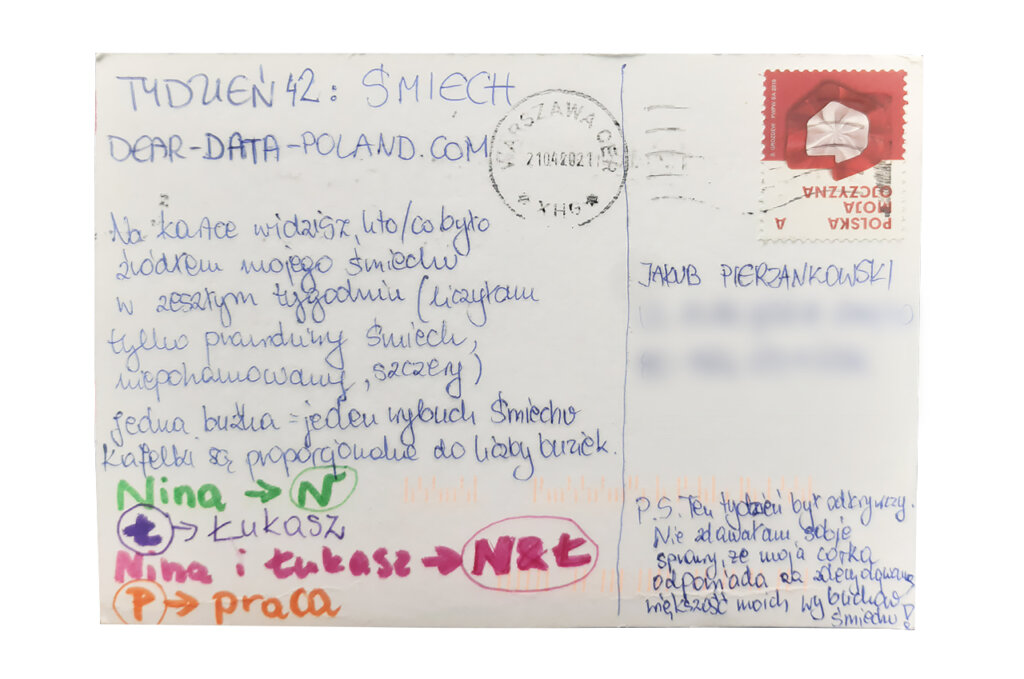
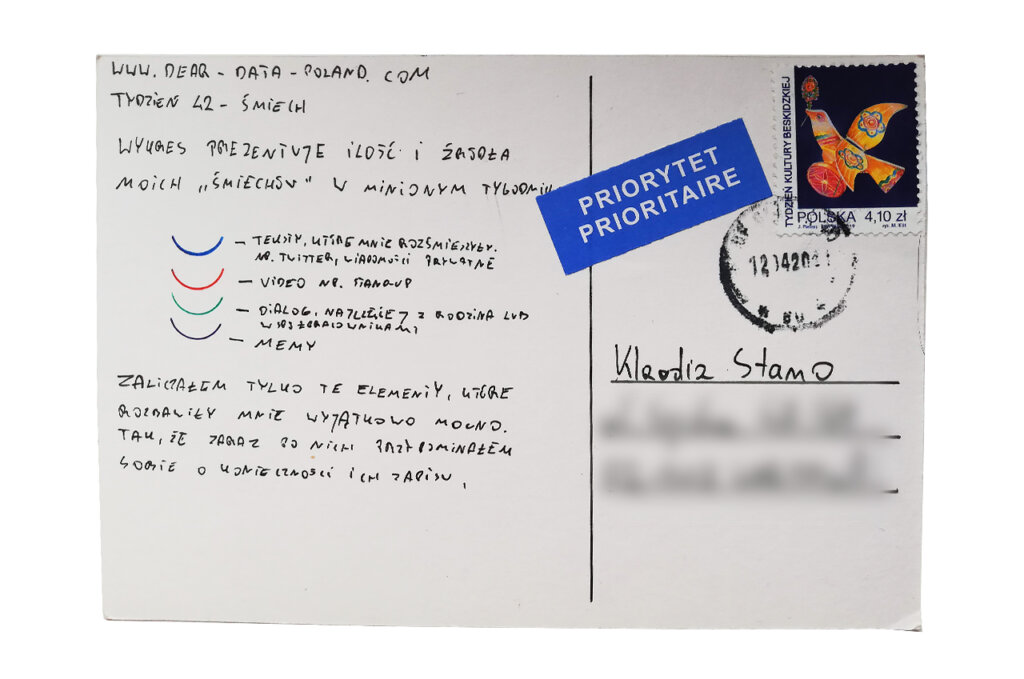
Laughter… In fact I have no idea how often I am laughing. I mean real laughter, honest and uninhibited. This week made me realize that I owe the vast majority of „laughter” to my three-year-old daughter, who is telling me more and more interesting stories each day, as she grows up. She discovers the Polish language, tests various word combinations, and I try not to laugh too loud 🙂

Data gathering:
I decided that I would only count the so-called bursts of laughter. In total, I counted quite a lot of them. The results surprised me. I didn’t really realize how empty my life would (probably) be without Nina.

Data drawing:
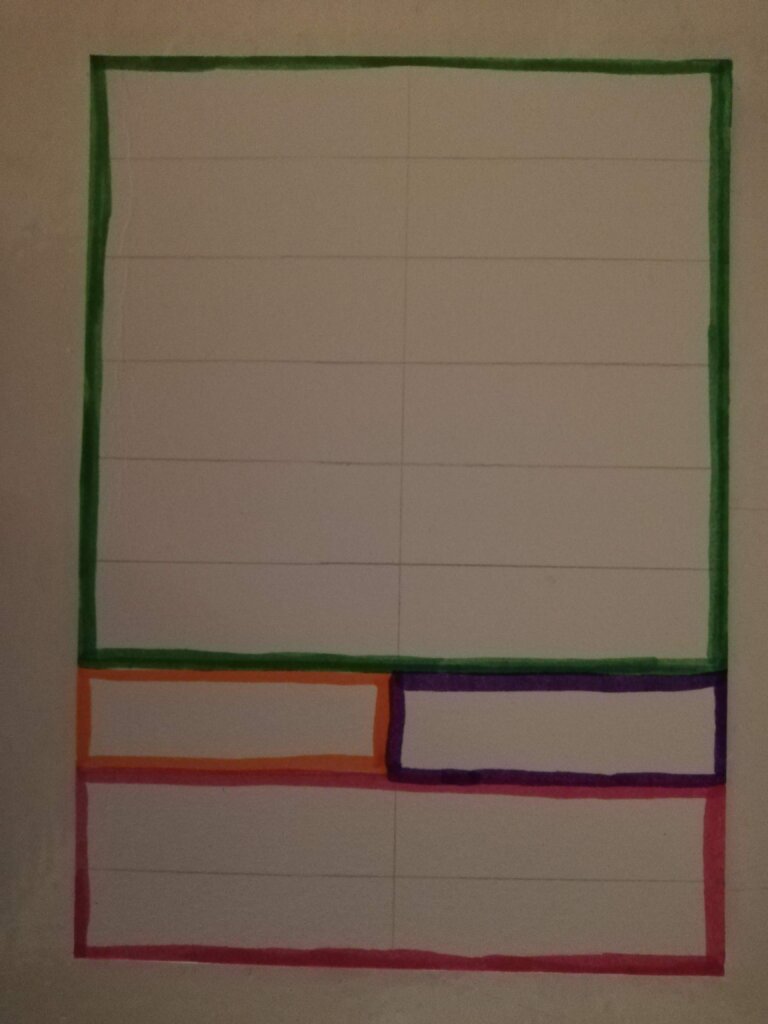
I didn’t have many ideas this week, so I chose a simple treemap. I enriched the chart with smiling faces to show exactly how many outbursts of laughter I had last week.

I noticed that I really like using a ruler and a calculator when creating postcards – I use these tools really often in Dear Data 🙂 I think I will never forget the size of an A6 sheet for the rest of my life.

Jakub’s postcard:

How many memes! Jakub, send me the funniest :-)! After seeing the postcard, I was a bit embarrassed that I was so monothematic, but it’s probably a matter of timing and the lack of live conversations with people (well, still the pandemic…).

The process:
Categories
Uncategorized

Week 41

Jakub

Topic:
I love music. It has always played an important role in my life since childhood. I remember listening to Michael Jackson, Depeche Mode or Perfect on the tape recorder. Later, this passion deepened. For a while, I even worked on reactivating a vinyl records factory in Poland. I remember exactly when I had iTunes installed on my computer, which showed the album covers. It worked the same in iPads and it was called Cover Flow. Thanks to this feature I remember quite well the covers of my favorite albums.

Data gathering:
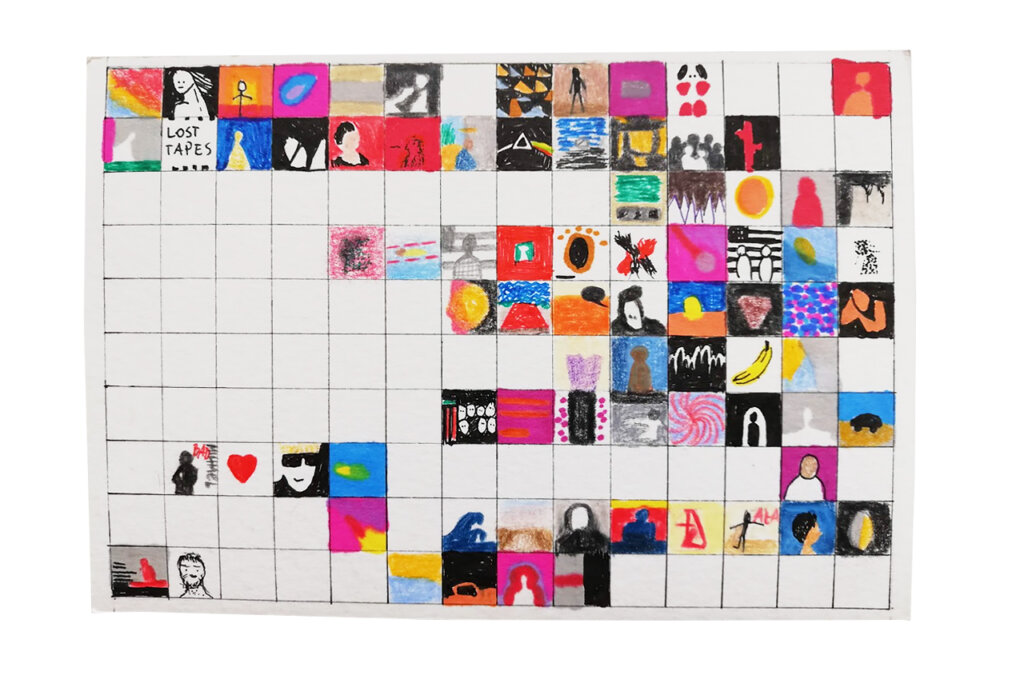
I tried to recall the albums that were important to me for various reasons. I was looking for their titles in my head and remembered the covers (Internet helped me, of course). Then I tried to redraw them as faithfully as possible. I was prepared for 140 titles, but finally I managed to remember 79.

Data drawing:
It took a long time – half a day. It gave me fun and my girlfriend Agata helped me a bit.

Klaudia’s postcard:

Indeed, this chart reminds me of my family’s cassette collection. Does anyone else remember that sometimes a pen was used to rewind the cassettes? 🙂

I think I listen to music more frequently than Klaudia. At work, Newonce Radio is on almost all the time. However, I dance less for sure: / Which, to be clear, I regret very much 🙂

The process:


Klaudia

Topic:
I love listening to music, especially in the last, pandemic year (which also coincides with the start of my regular Spotify subscription). I love music, even though I do not know much about it and I do not follow the lives of artists or industry news.

Music accompanies me most often at work, where it helps me focus and relax. I love film and classical music. During the pandemic, I also started dancing more at home (mainly to my favorite hits from the 60-70-80-90) and I really appreciate those moments of detachment!

Data gathering:
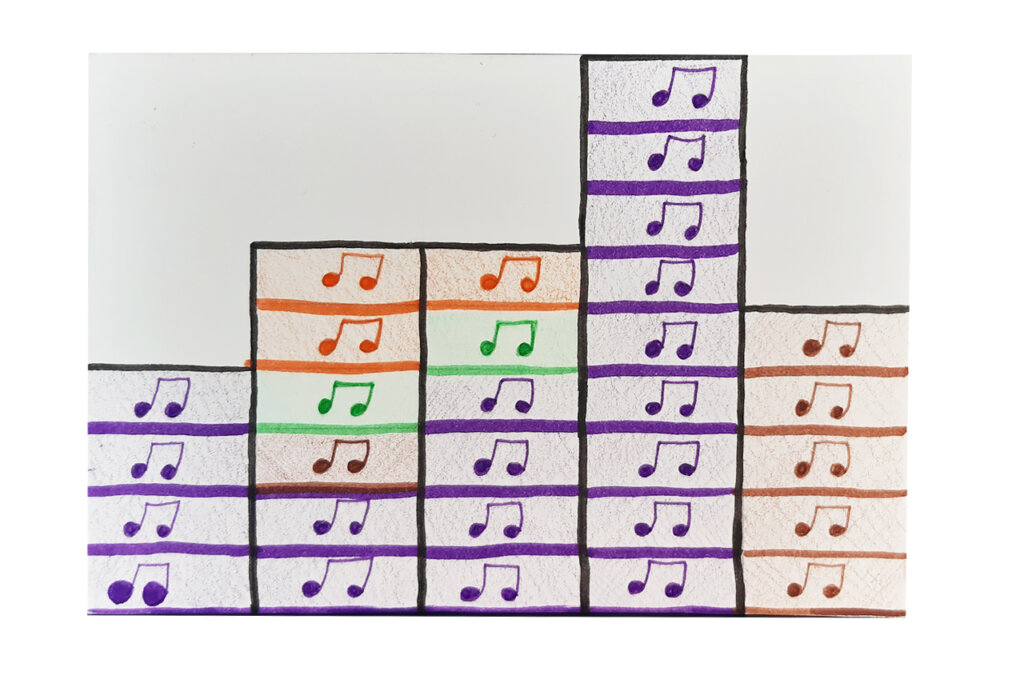
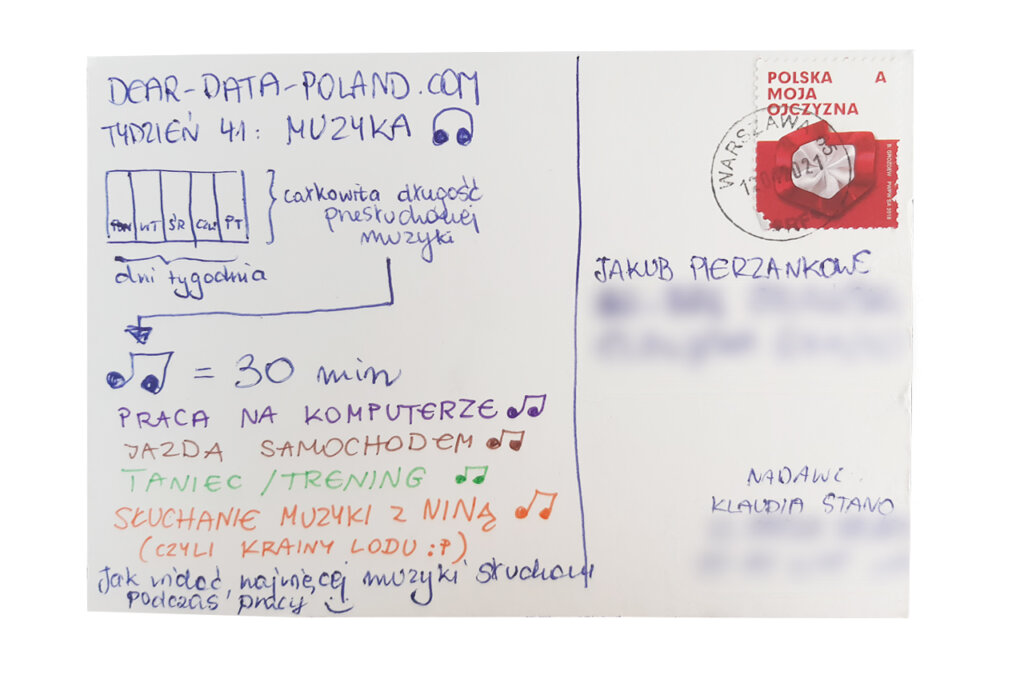
I wrote down where and when I listened to music. I knew work would be the broadest category, but I wanted to see how it would compare with other areas of my life.

Data drawing:
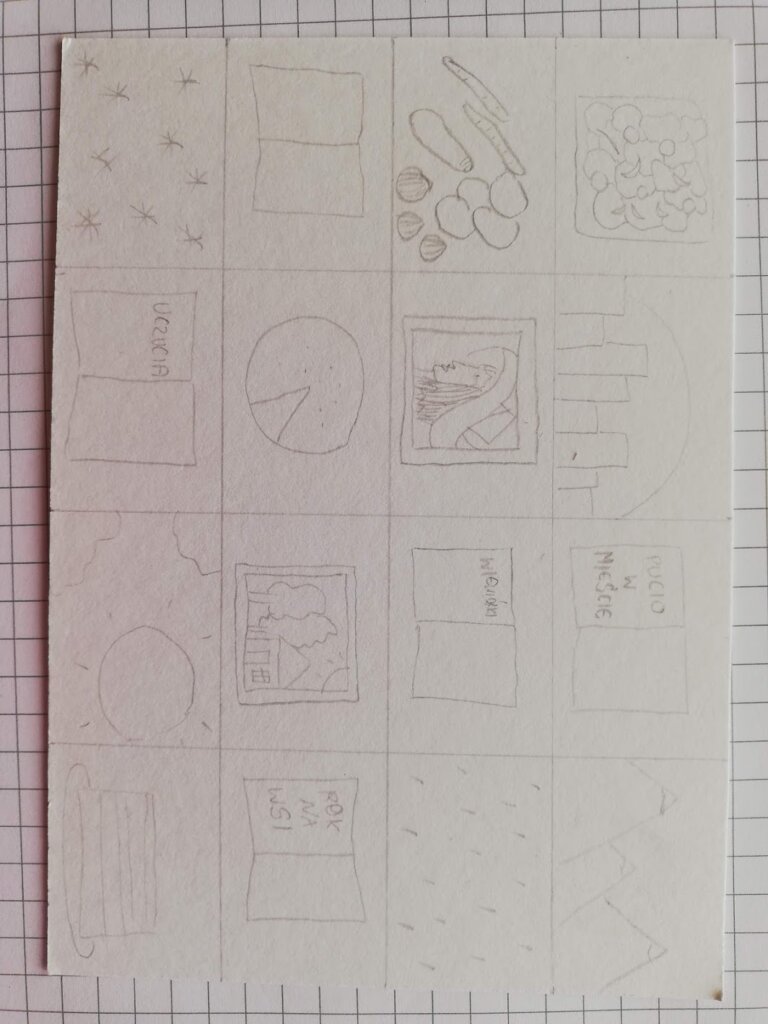
Yes, I missed a good bar chart! Plus, I wanted the postcard to somehow reflect the topic: music. All in all, the postcard came out quite ordinary, but I’m happy with it. The arrangement of the “blocks” reminds me a bit of the cassettes I listened to at the beginning of elementary school.

Jakub’s postcard:

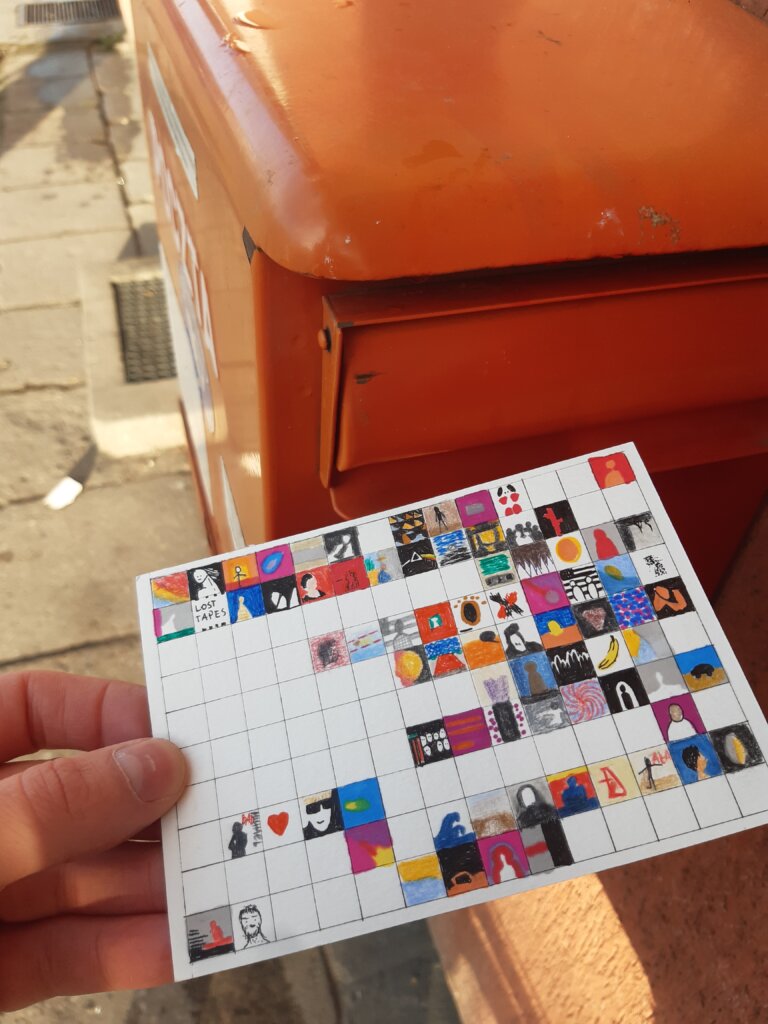
Wow. Is it really not printed? An unusual postcard. I like it very much. I didn’t think so many details would fit into a small piece of paper. And I also have a personal reflection: I don’t remember any album cover from my life. I don’t think I ever paid any attention to it.

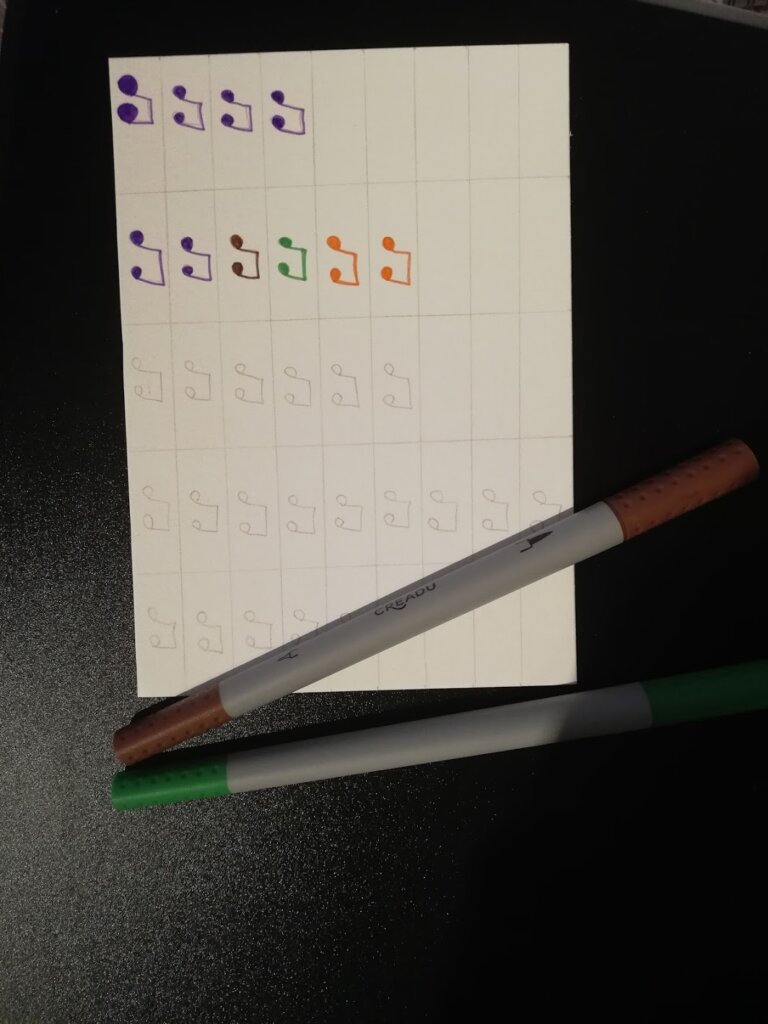
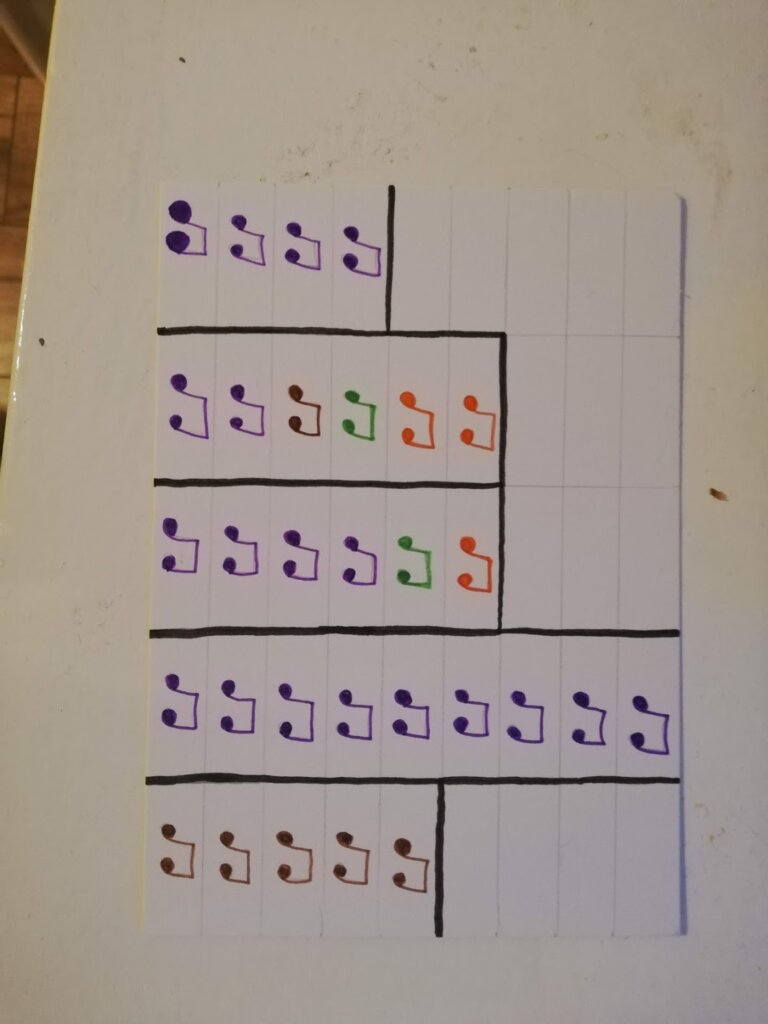
The process:
Categories
Uncategorized

Week 40

Jakub

Topic:
I love meeting new people. I enjoy the process of learning about people and changing my ideas about them. For me, it is one of the most fascinating phenomena, in which there are both positive and negative surprises.

Data gathering:
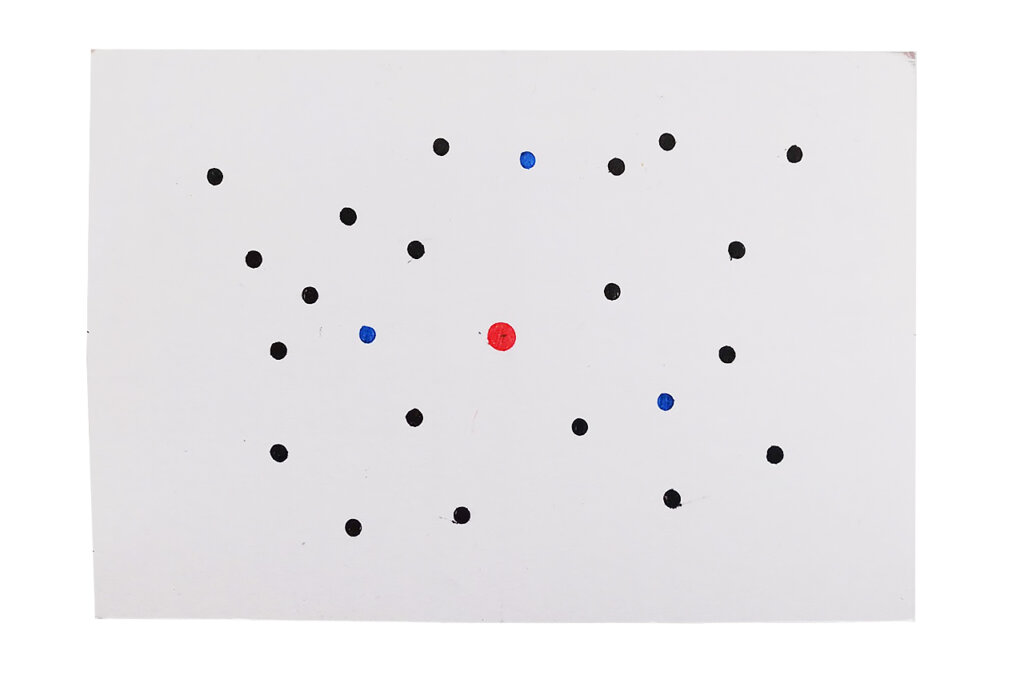
I focused my attention and senses on people. Who am I talking with? Are they newly met people or well-known friends? The vast majority of my interpersonal relationships were related to people I know well (family, close and distant co-workers). Last week, three new people appeared in my surroundings: a new receptionist at work, a newly met employee from another department of the company, and a car salesman with whom I talked for quite a long time.

Data drawing:
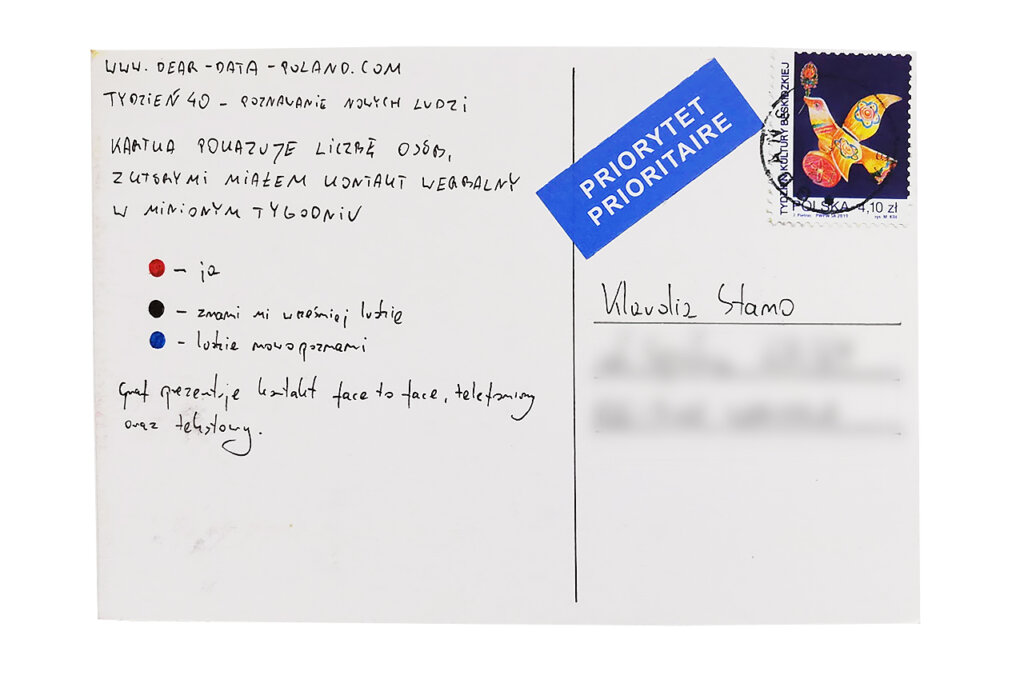
I expected that there won’t be much data this week. Therefore, apart from newly met people I also counted my contacts in general. My chart shows both groups. Last week I met 23 people, 3 of which I saw for the first time.

Klaudia’s postcard:

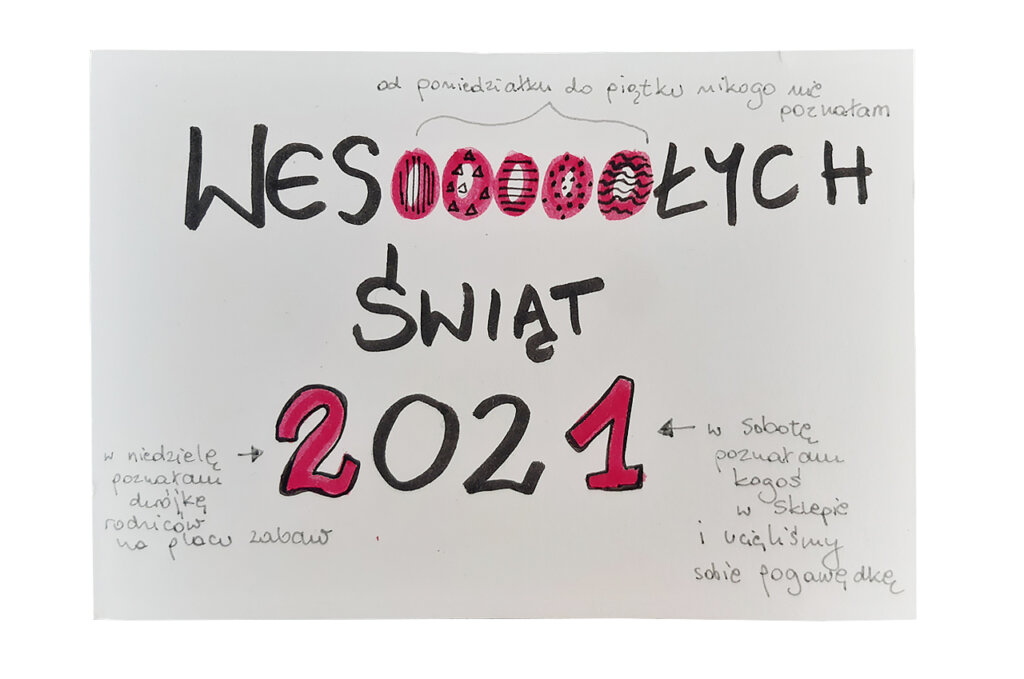
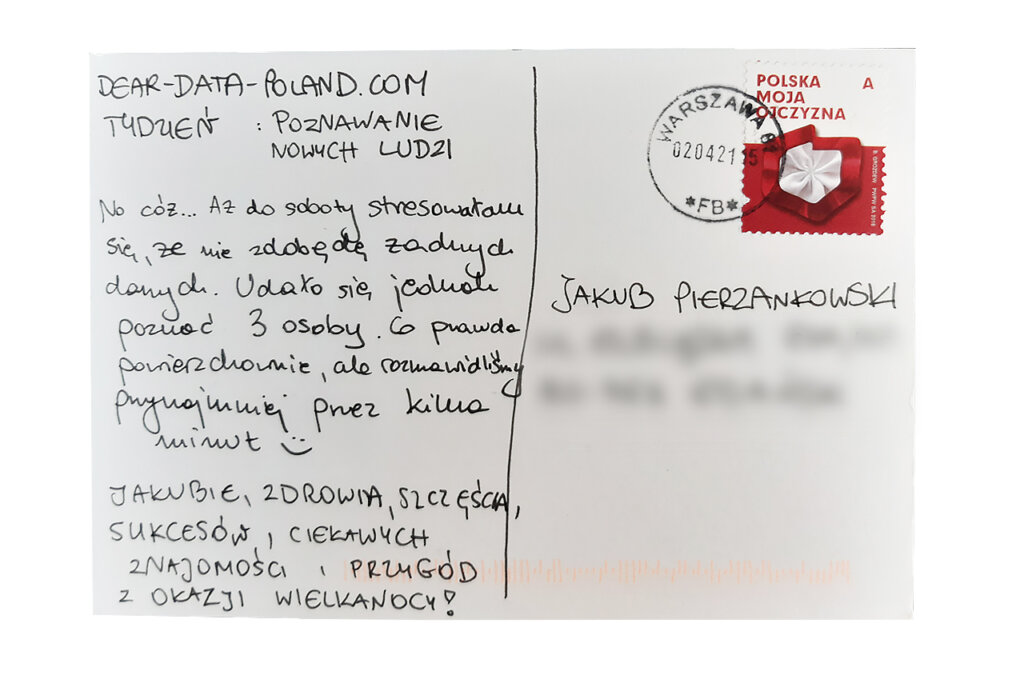
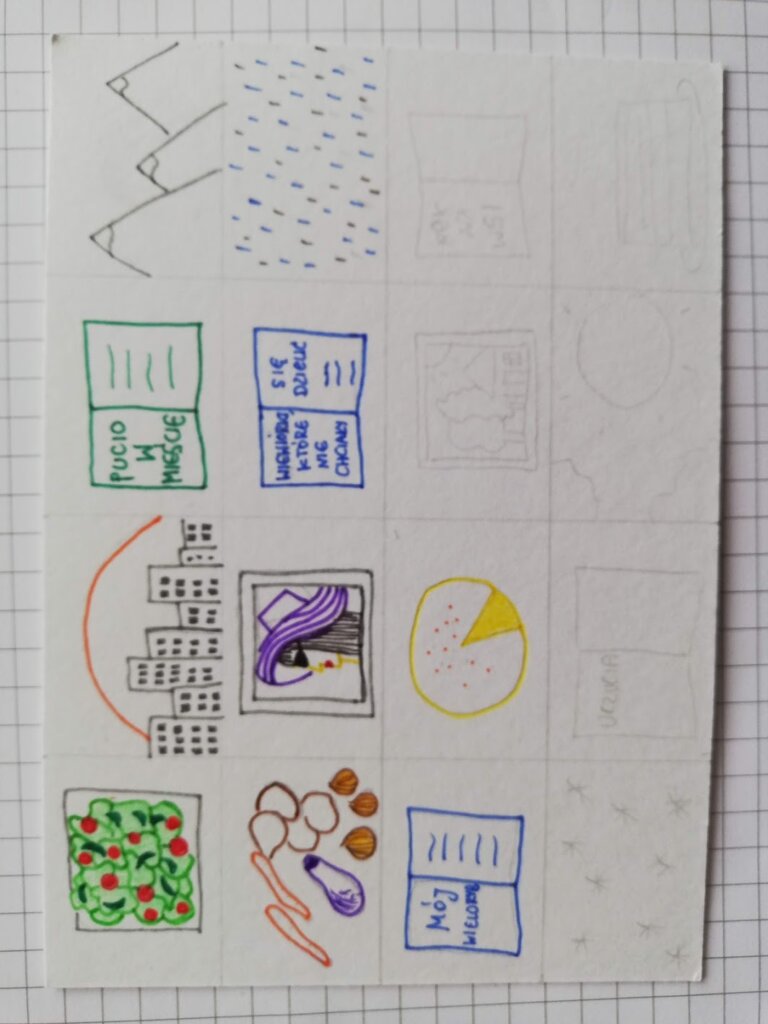
Klaudia’s postcard and mine have a lot in common. Both present the same number of newly met people. Klaudia’s postcard is much more creative… Thank you very much for your wishes!

The process:


Klaudia

Topic:
Yet another topic in Dear Data that highlights the sad effects of pandemic. If I already meet new people, it’s either at online events (which I didn’t attend this week) or at a nearby park, store or playground. I regret that there are so few opportunities to establish relationships, even superficial ones. I value new acquaintances, because they are refreshing. I see great value in getting to know different points of view, experiences and opinions. Meetings and conversations with new people allow me to look at my own views from a distance, get interested in new fields and rethink some topics.

Data gathering:
This week I was actually “taking a break” from collecting data because there was so little of it… I didn’t have to write anything down, I remembered the small number of superficial acquaintances that I made.

Data drawing:
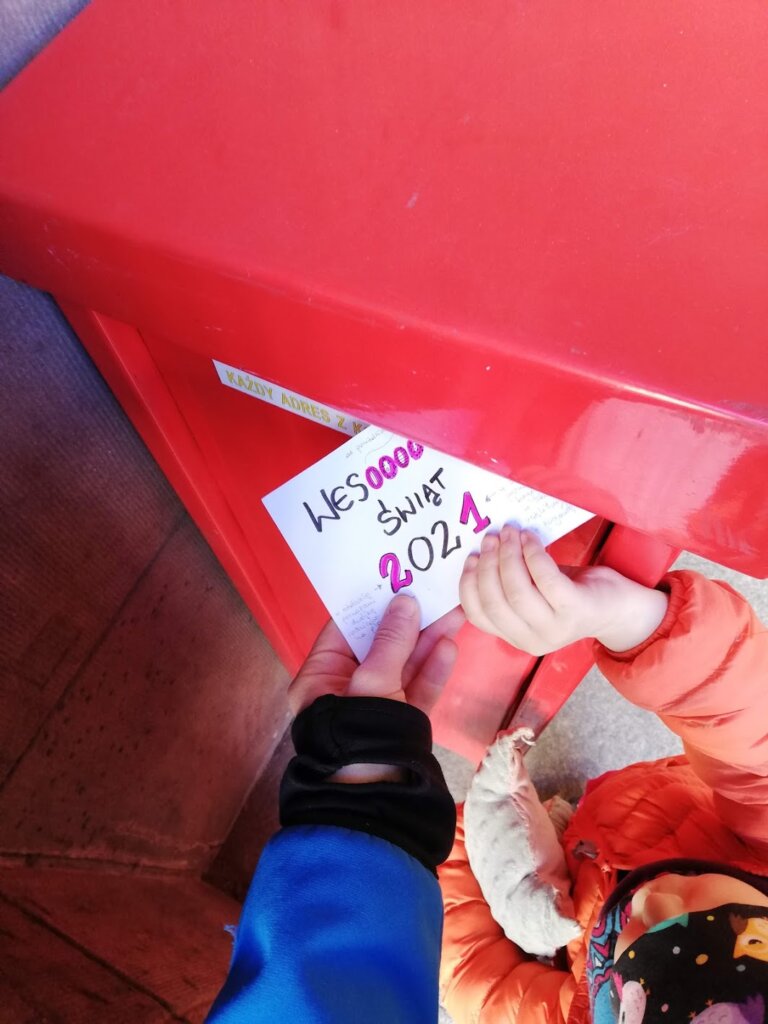
When I wrote down the number of people I met in the following days of the weeks, I saw only the numbers 0,1 and 2 on the piece of paper. I thought that these numbers could be used to write the year 2021. As Easter was approaching, I created a simple postcard wishing Jakub all the best, and at the same time smuggling information about the few new acquaintances I was able to make.

My only regret is that I did not keep the postcard green and did not draw the Easter bunny!

Jakub’s postcard:

I can see that Jakub also struggled to make friends this week. I am curious how much would this number differ if we did not have to spend so much time in isolation.

The process:
Categories
Uncategorized

Week 39

Jakub

Topic:
I appreciate beauty in objects, people, animals and plants. Beauty is soothing for me, but sometimes also embarrassing. At times I feel that I do not deserve to enjoy exceptionally beautiful things or people. Micro complexes 🙂

Data gathering:
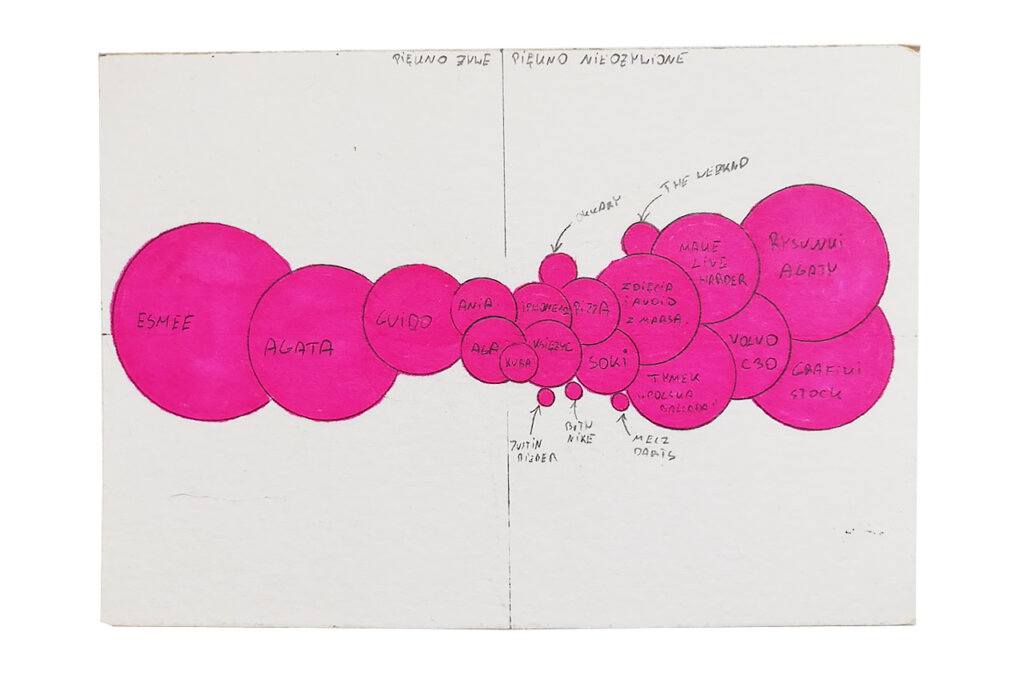
I did not collect data on an ongoing basis. Before drawing the postcard, I tried to recall all my contacts with beauty. The fact that I remembered something was a proof that it made a great impression on me. All these memories were evaluated on a subjective scale from beautiful! (beauty worth noting) to wooooooow! (I have not seen anything more beautiful).

Data drawing:
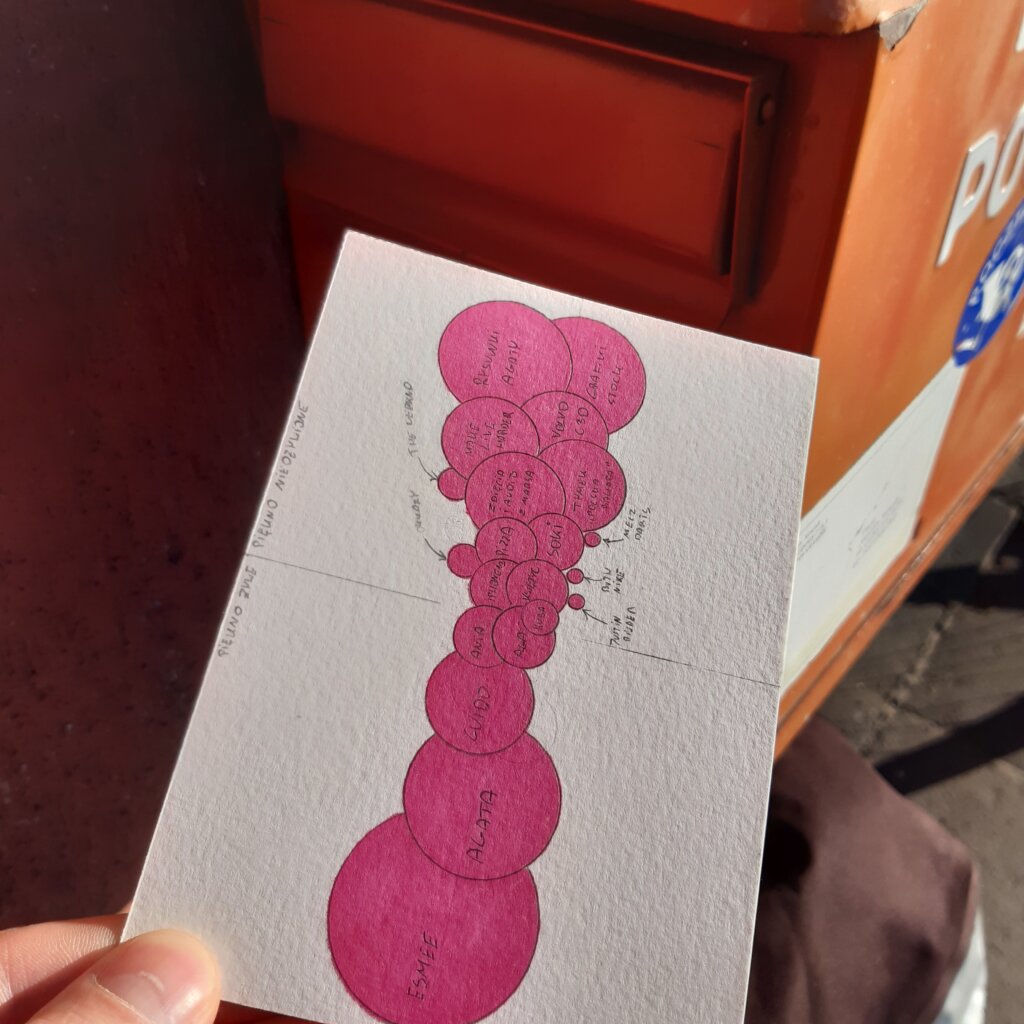
I divided the chart into two categories. Animated beauty (people, animals) and inanimate beauty (objects, music, etc.). I used a bubble chart to present the scale of beauty.

Klaudia’s postcard:

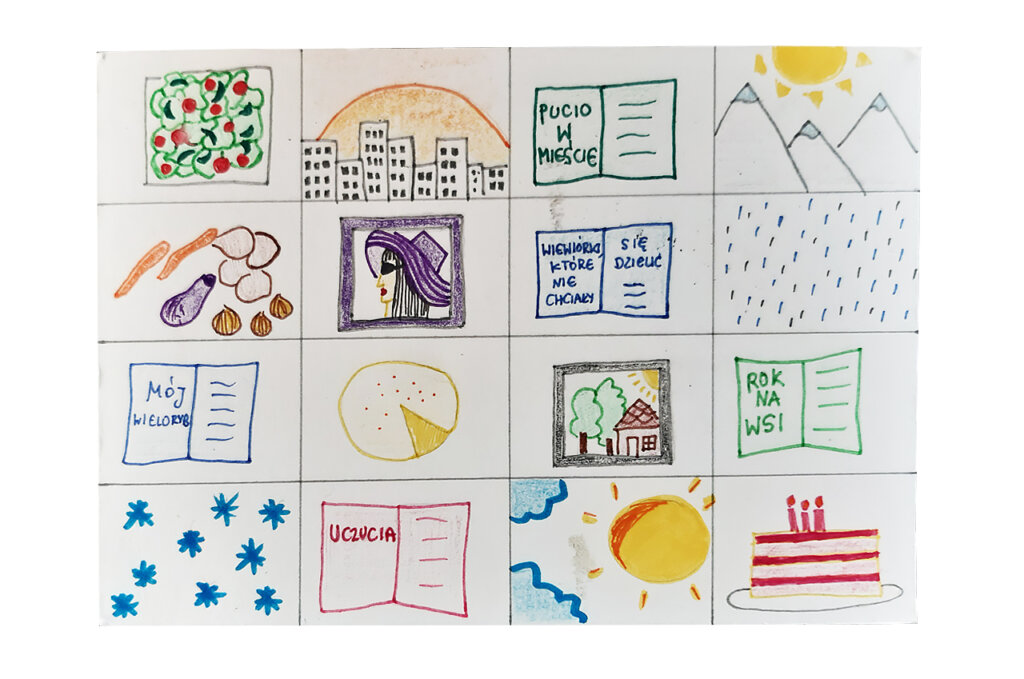
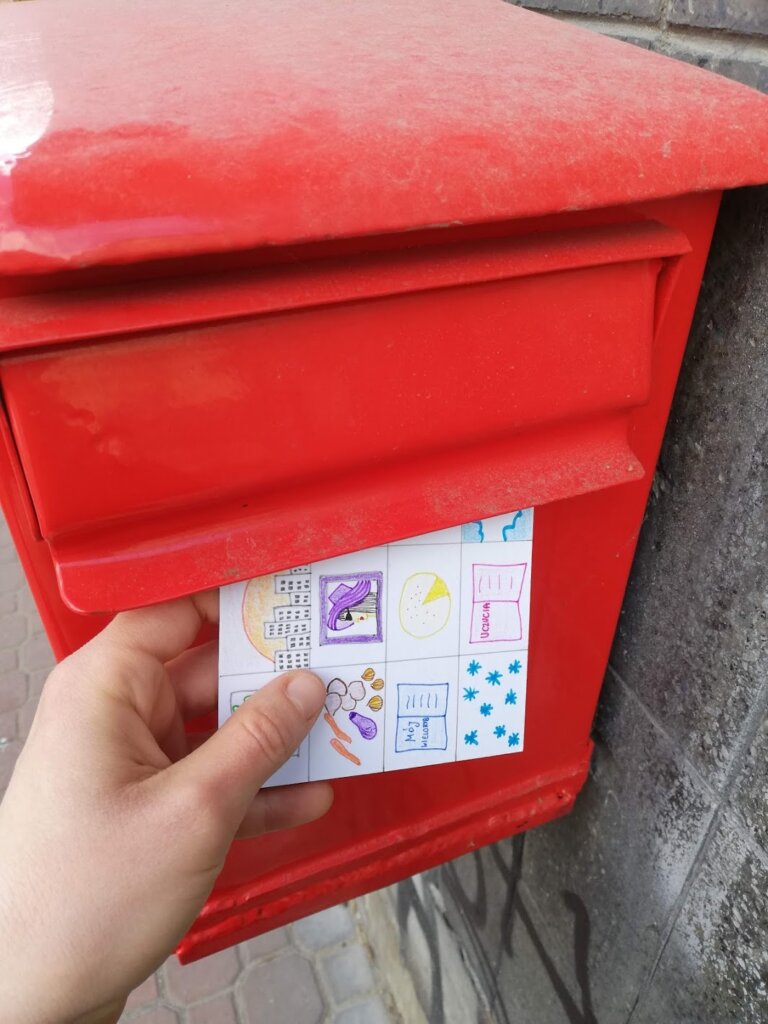
Klaudia’s postcard is enigmatic, but it shows well that beauty can be found in many usual and unusual situations. Who would have guessed that this pie chart was a cheesecake;)

The process:


Klaudia

Topic:
In the everyday frenzy I often forget to observe the beauty that surrounds me. This sad reflection usually comes to me during holidays, when I break away from everyday life and start noticing (and appreciating!) the sun, flowers, animals, meals… This week was a great opportunity for me to pay more attention to what pleases the eye.

Data gathering:
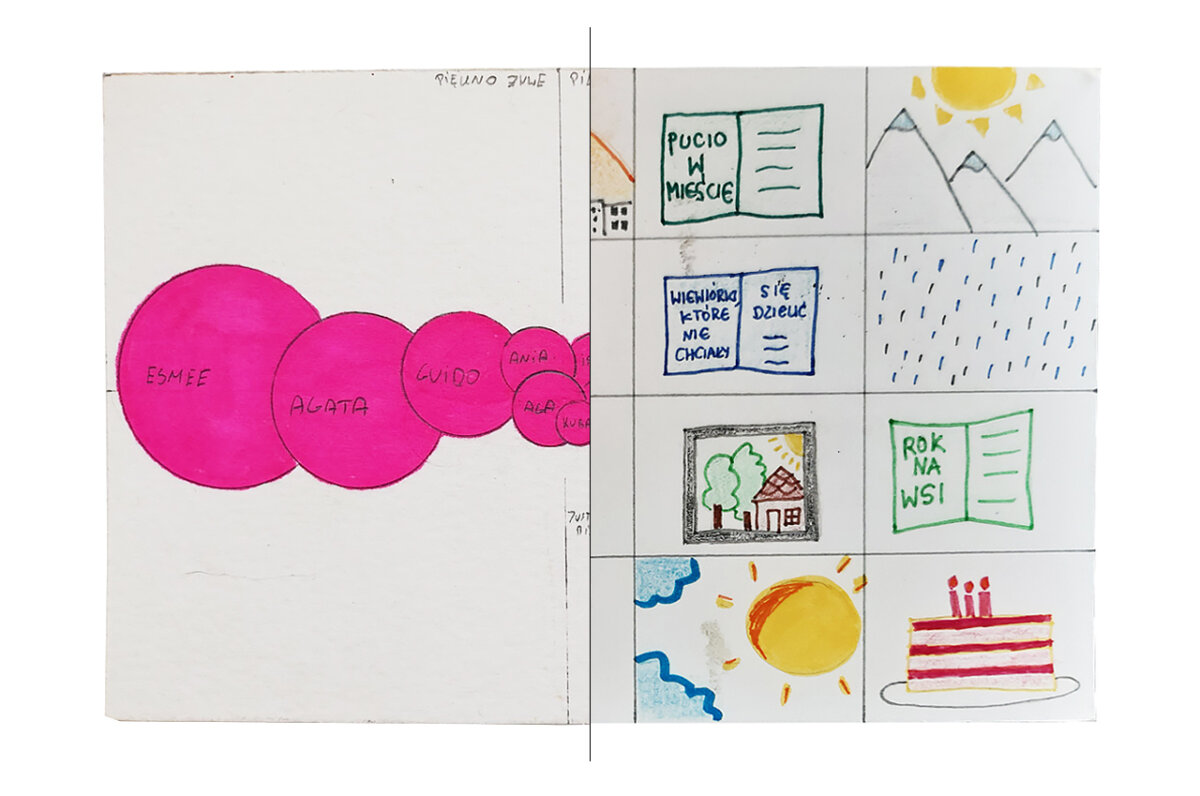
I wrote down on a regular basis things that caught my eye: meals, book illustrations (especially in my daughter’s books), weather phenomena and paintings.

Data drawing:
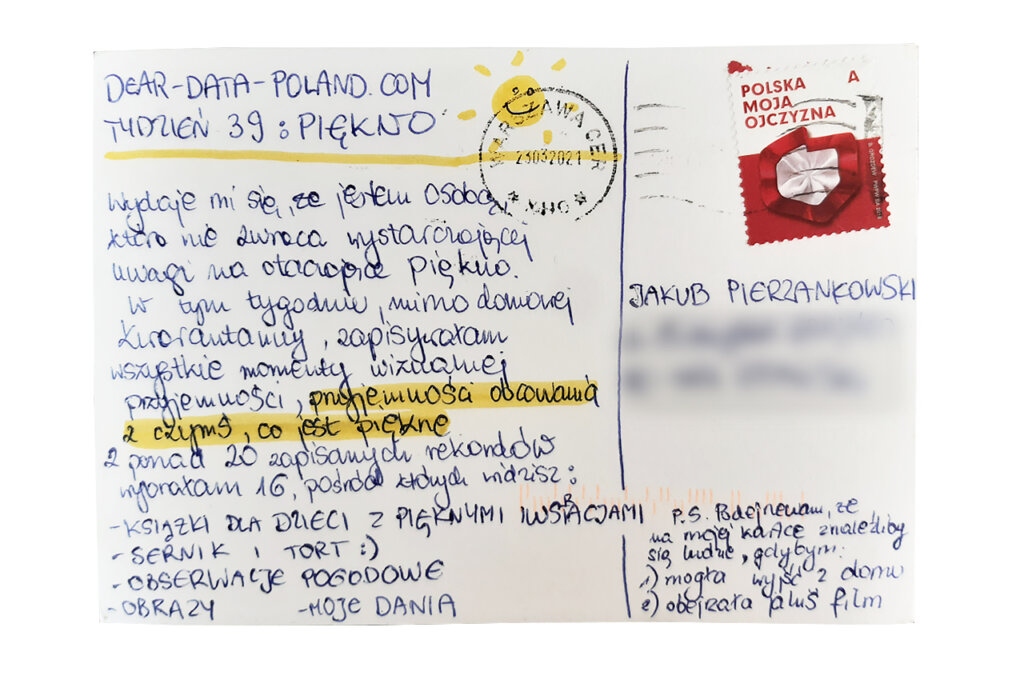
From over 20 records I have chosen the most interesting 16 data points. This time I decided not to categorize my data, and instead devote some space to each beautiful thing that I have seen.

Jakub’s postcard:

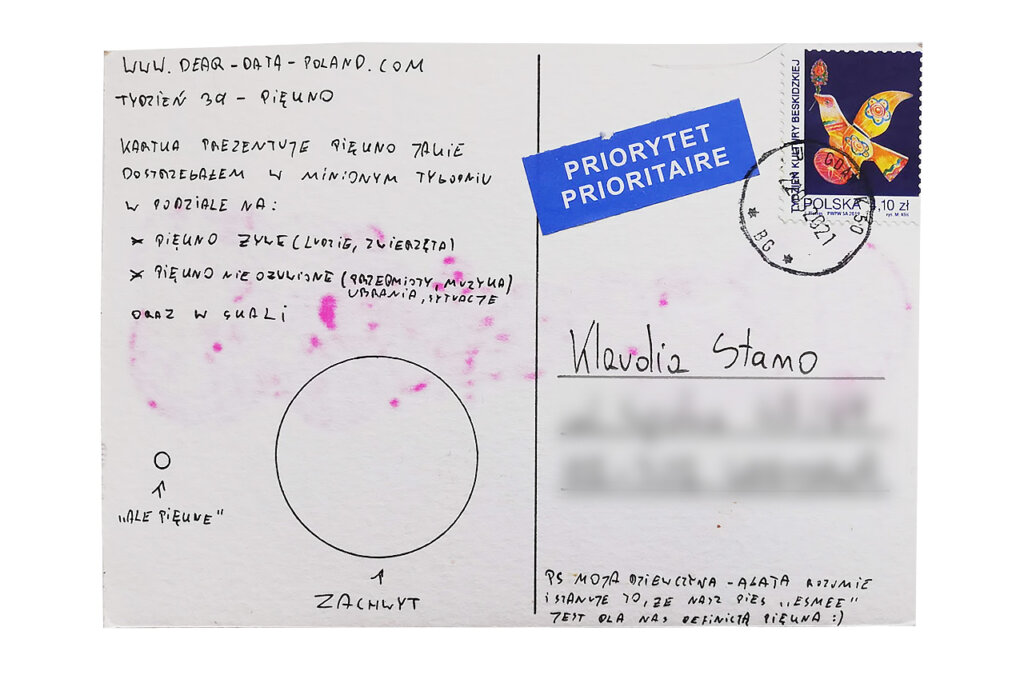
A very interesting classification. I must admit that it took me quite long to realize who was Esmee. I thought it was some famous actress or singer but a Google search showed no results. In the end, it turned out to be… Jakub’s dog 🙂

The process:
Categories
Uncategorized

Week 38

Jakub

Topic:
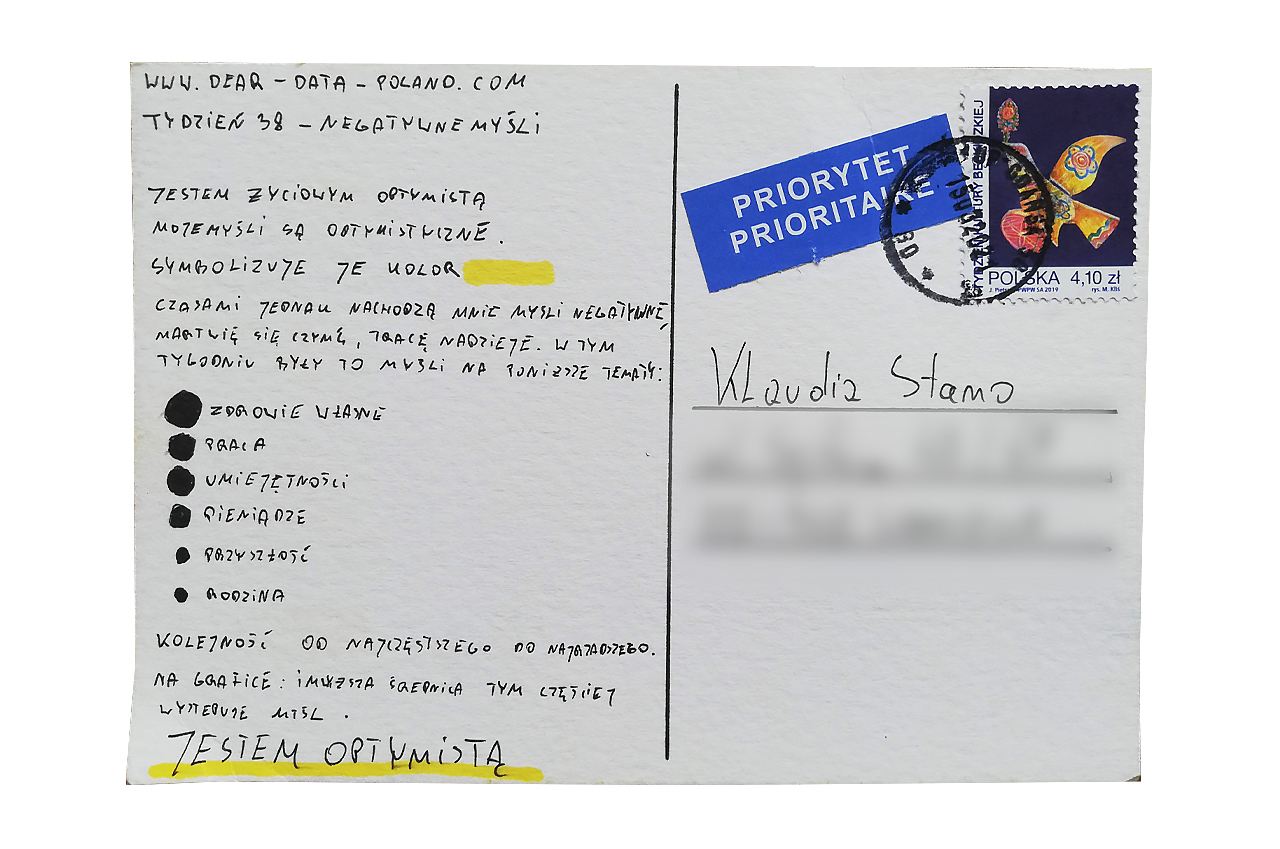
It is said that depression is taking its toll alongside the coronavirus epidemic. Fortunately, this terrible disease has not affected me yet. I am an optimist in life and rarely fall into negative thoughts, but it does not mean that such thoughts do not happen.

Data gathering:
Every night before going to sleep, I was doing a so-called “examination of conscience”. I analyzed the past day and tried to write down negative thoughts and what they were about. I am glad that there were relatively few of them. Most often they concerned my health, e.g. “I have a fever, what if it’s covid” or work, e.g. “I think I have not performed well enough”.

Data drawing:
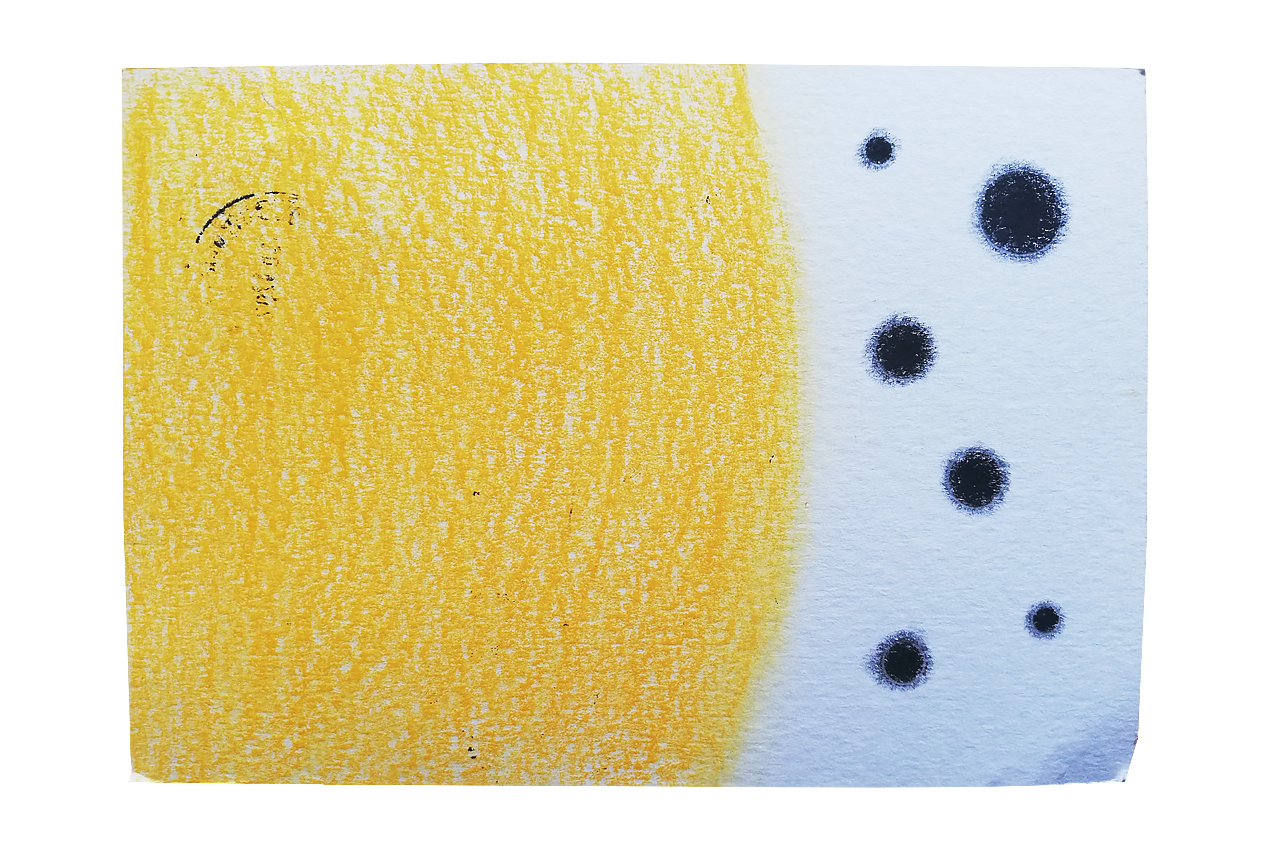
I wanted the postcard to turn out optimistic. After all, negative thoughts for me are an exception, not a rule. That is why I decided to depict them against the sunny background full of good energy.

Klaudia’s postcard:

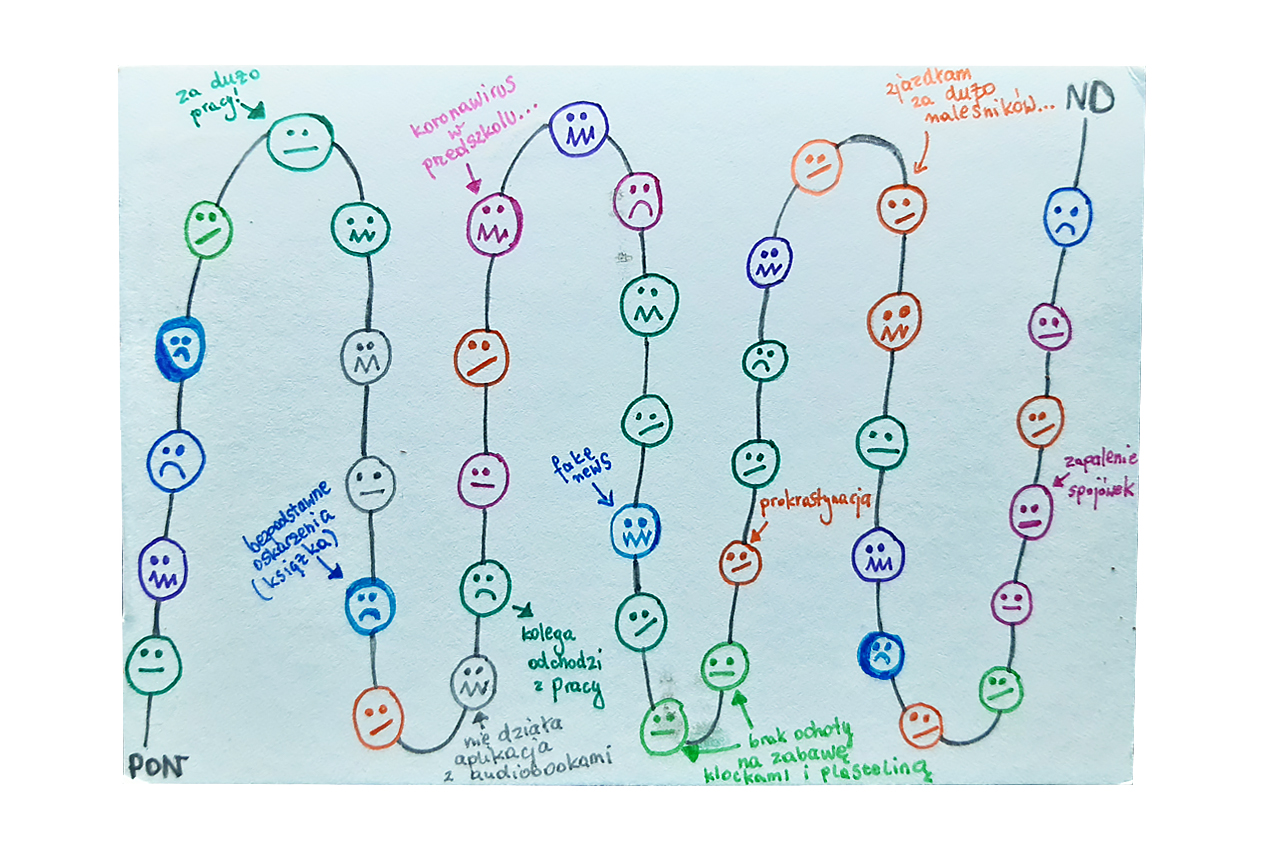
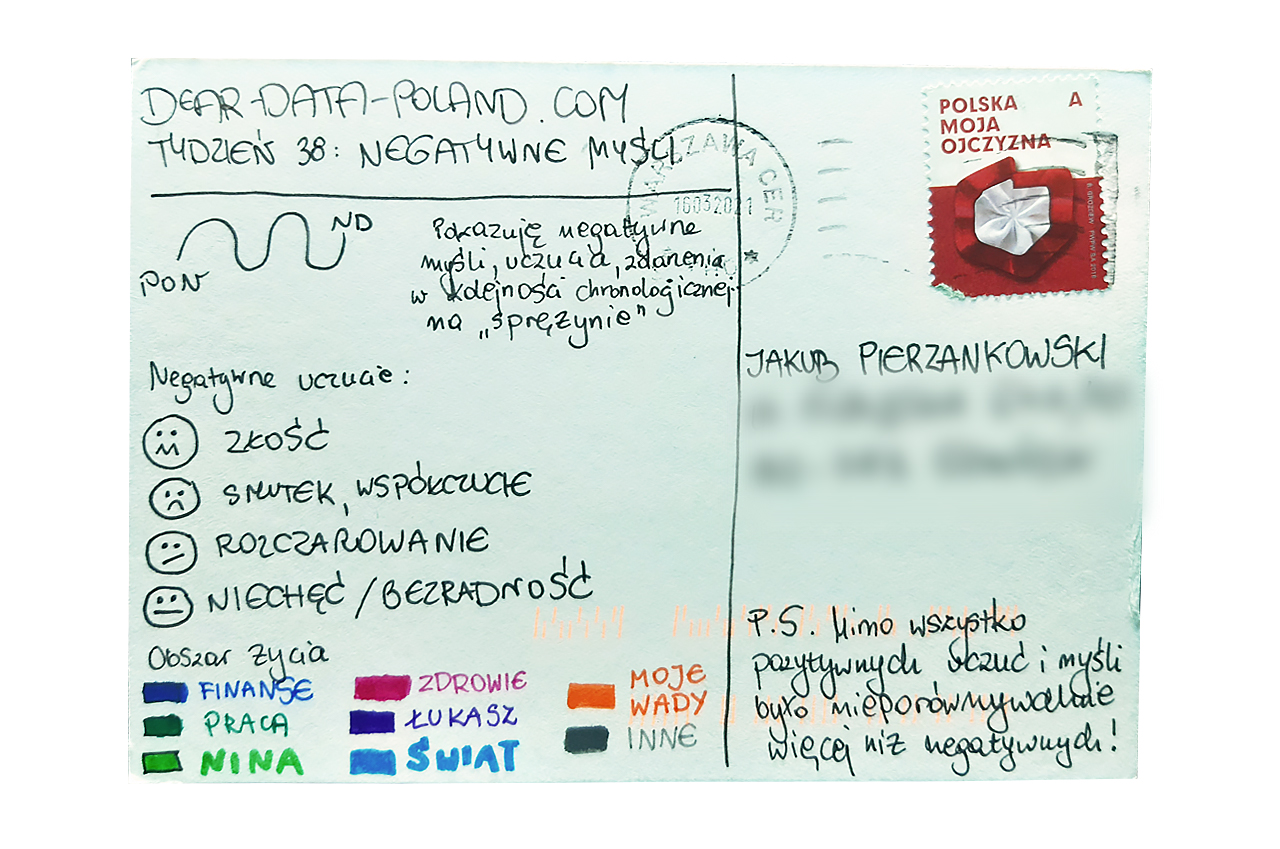
Klaudia’s postcard is much more detailed than mine. It illustrates selected reasons for negative thoughts. It is a pity that the spiral does not show positive thoughts for comparison. But I know it would take a lot of work. After all, as Klaudia wrote on the reverse, positive moments happened much more frequently.

The process:


Klaudia

Topic:
Everyone has negative thoughts and bad moments – so do I. Fortunately, those bad times are much less frequent than the moments of joy, excitement and pleasure. Since I do not monitor bad emotions on a daily basis, I was curious about the results of this observation, which I will probably not repeat in the future.

Data gathering:
I observed negative thoughts on an ongoing basis and wrote them down in a notebook on my phone or in a book calendar. In addition, in the evening I checked if I had missed something.

Data drawing:
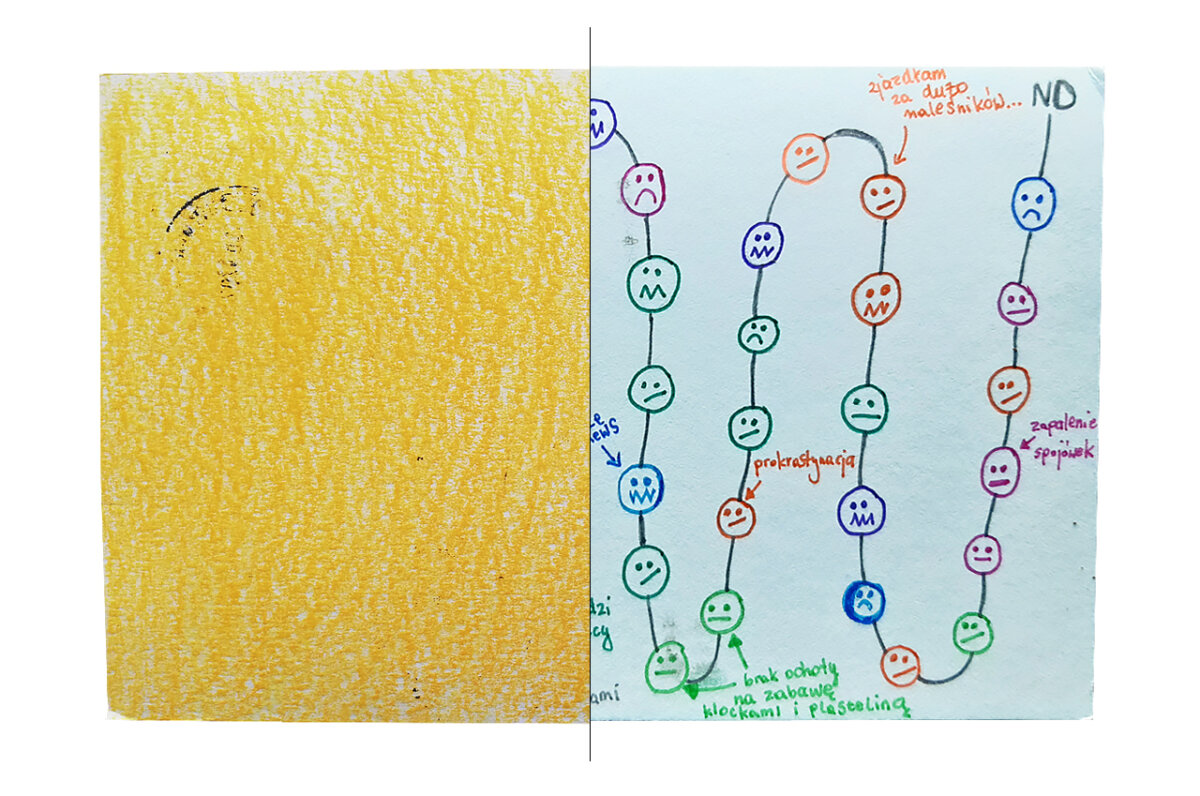
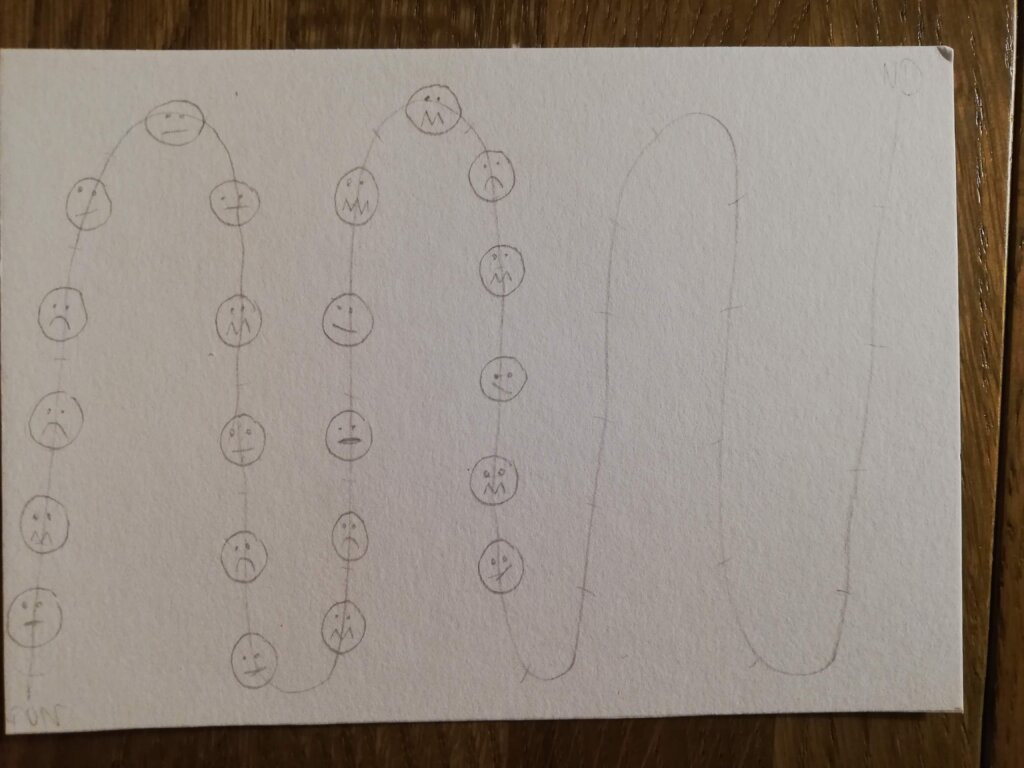
When I started cleaning and summarizing the data, it turned out that not all negative emotions were the same. Sometimes I felt sad, sometimes helpless, sometimes angry. I pictured it as different “smileys”. I also observed that last week I felt bad emotions in almost every aspect of my life: at work, in relationships with others, in my relationship with myself or because something happened or went wrong in the world.

Unfortunately, my postcard looks like a series of misfortunes. In fact, there were many, many more good emotions!

Jakub’s postcard:

I really liked that Jakub approached the topic of negative thoughts positively and showed them along with the multitude of good moments. I am glad that the sun is shining and warms the worst moments in life.

The process:
Categories
Uncategorized

Week 37

Jakub

Topic:
I treat swear words as a sign of not coping with emotions. When I was in university and later, they were practically non-existent in my vocabulary. Recently, I find myself using them more often. My approach has also changed. I treat swear words rather as a spice – I use them occasionally, but with full awareness.

Data gathering:
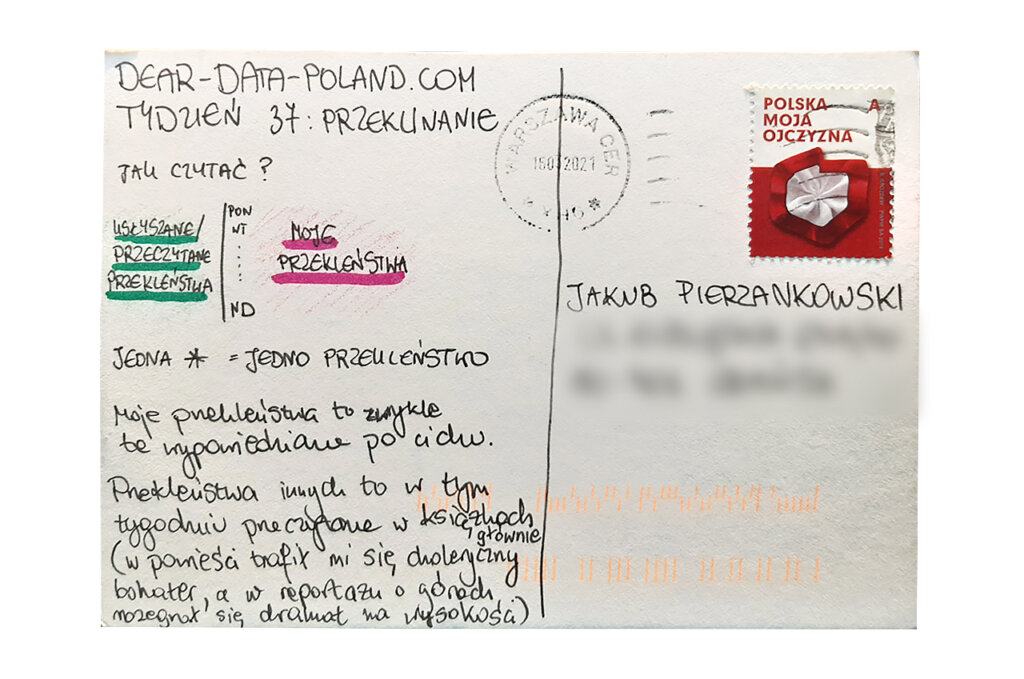
Data collection was simple. I used my proven method: hourly reminder to write down all swear words. I think there were relatively few of them. On average, I used 9 swear words per day, most often starting with K.

Data drawing:
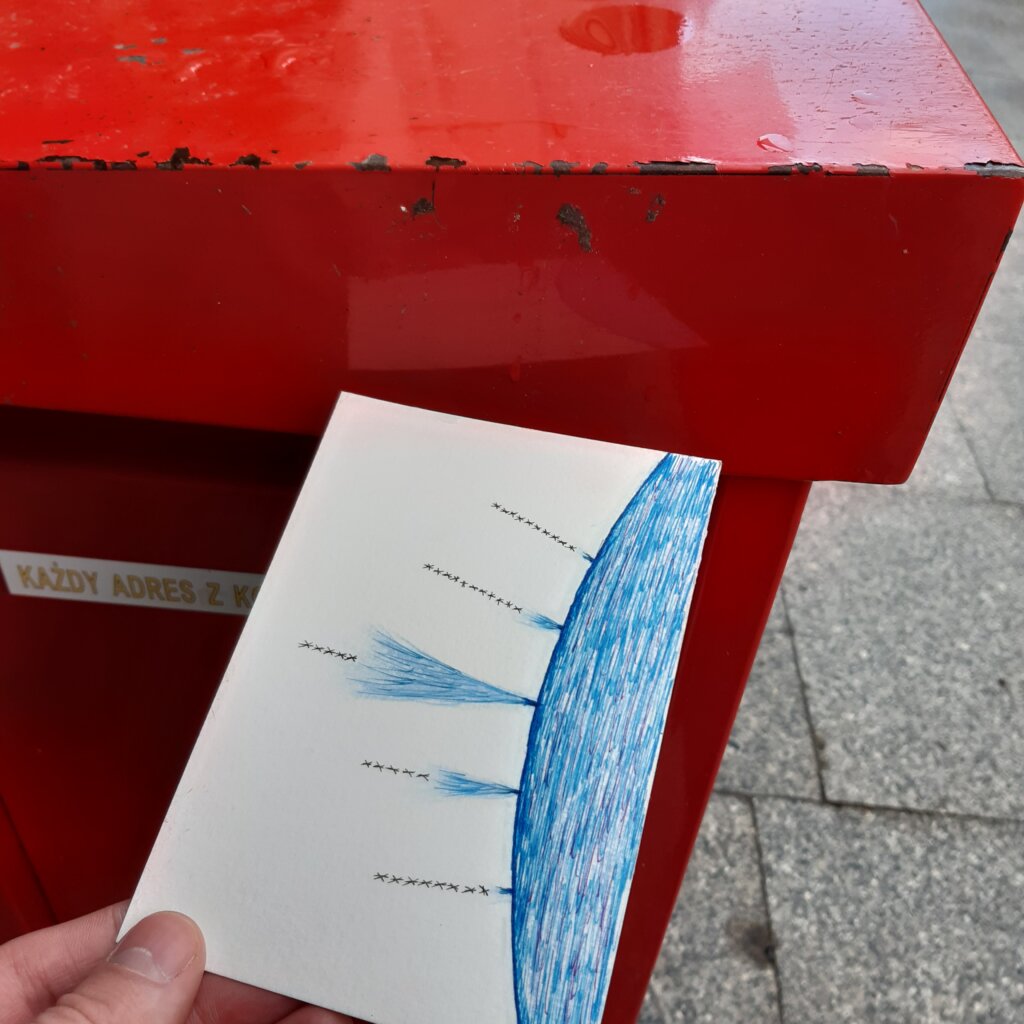
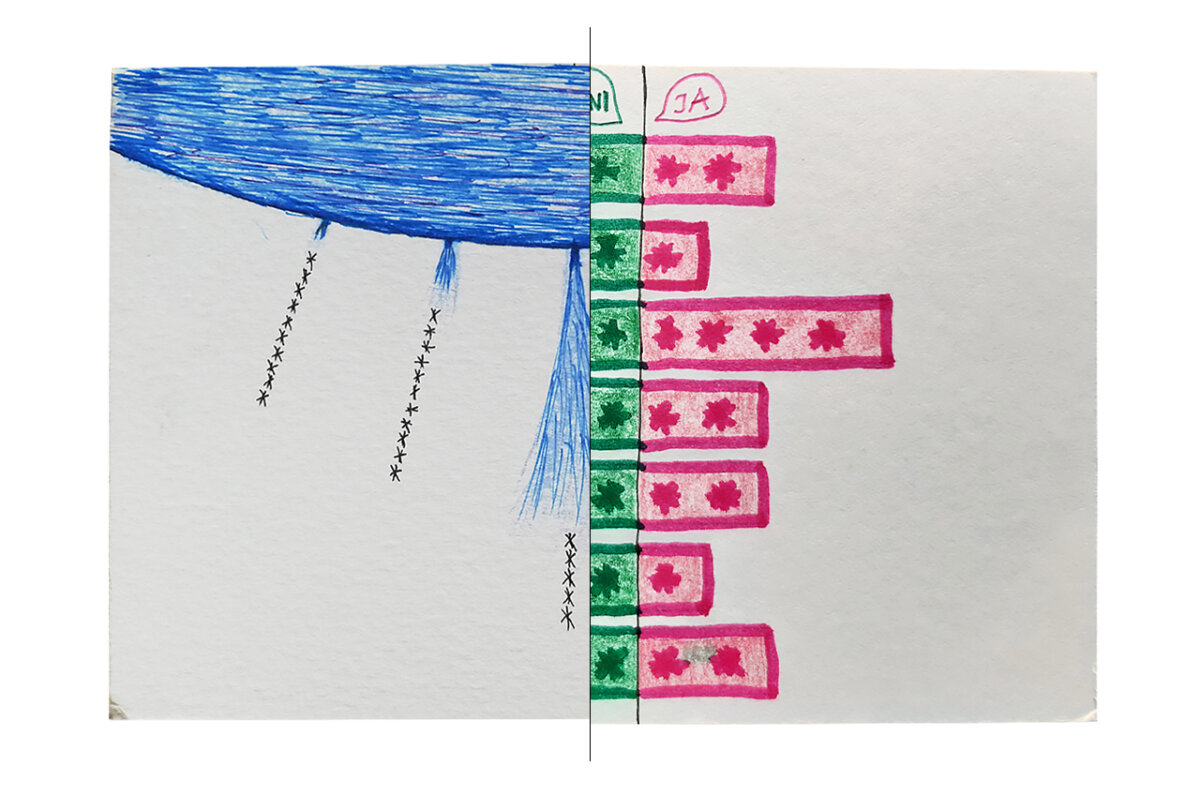
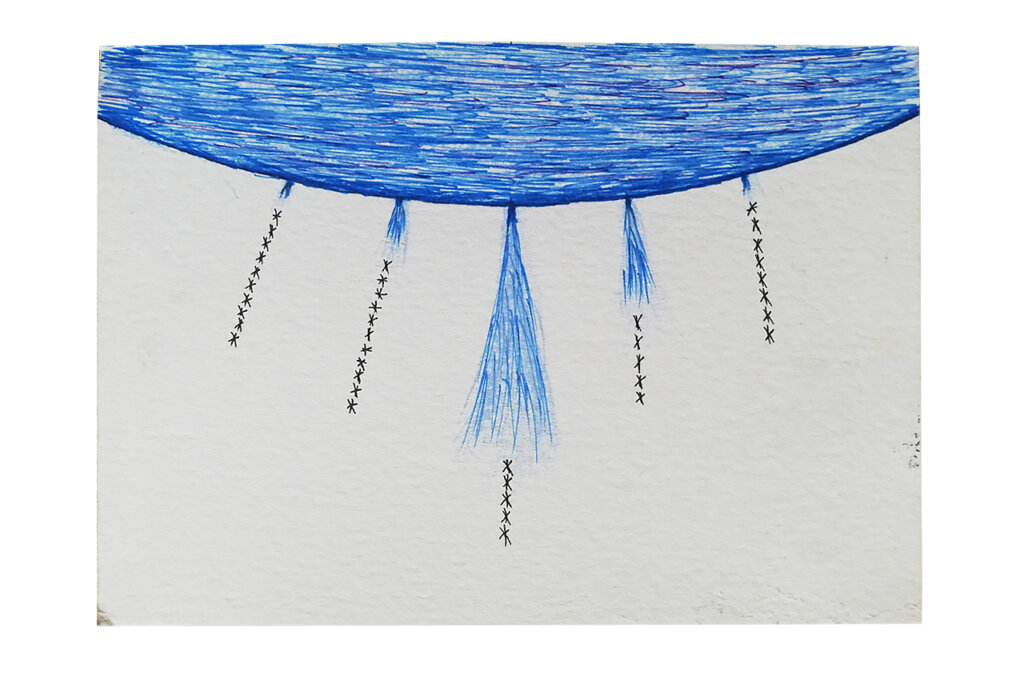
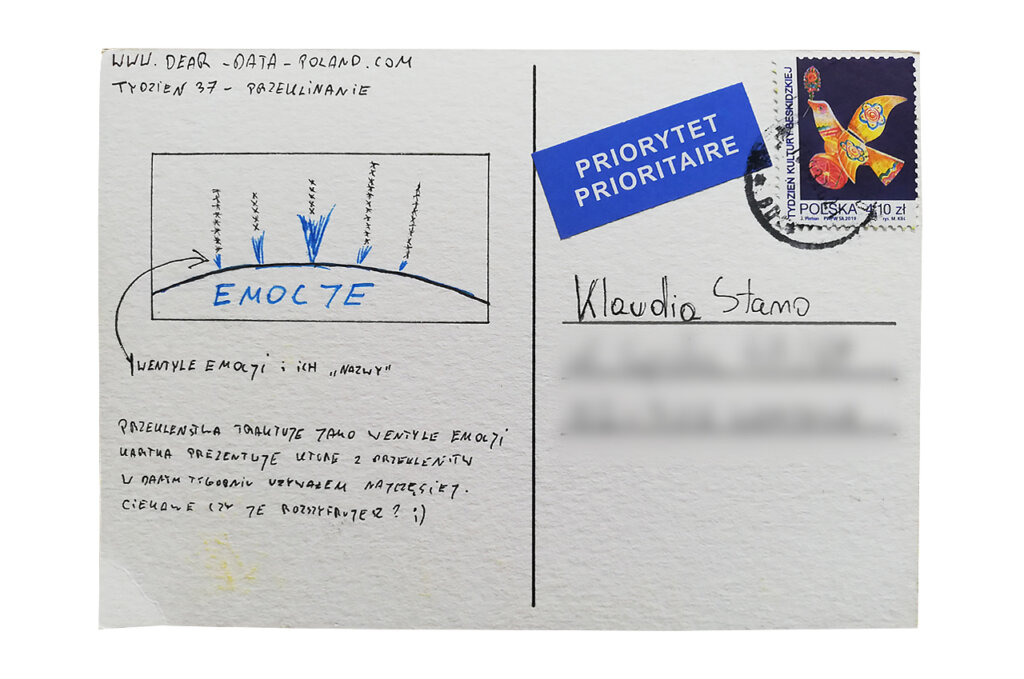
I pictured the data as a balloon and the emotions escaping from it through swear words as outlets. I used the star symbols on purpose. The second place in the statistics of the swear words I use was ***** out of the iconic ***** ***.

Klaudia’s postcard:

I got to know Klaudia both through the analysis of her postcards, but also during several meetings and quite long conversations. Definitely swear words do not suit her. I expected that there would be few of them. Therefore, I fully understand that the statistics also include swear words heard and read.

The process:


Klaudia

Topic:
I don’t swear too much, but it depends on the period of my life. I’m definitely trying to avoid it. Swearing doesn’t help me at all, and it doesn’t relax me. On the contrary – it usually makes me even more angry.

Data gathering:
I wrote down every swear word I said (usually to myself) and heard / read. As luck would have it, almost every evening I was reading a novel by Isabel Allende with a very explosive main character, who definitely accounts for a large part of my postcard. I also listened to an audiobook about climbing in the Himalayas, and there were also swear words in moments of danger and helplessness. I heard only one swear word from another, living man – my husband during an argument. Well, the pandemic…

Data drawing:
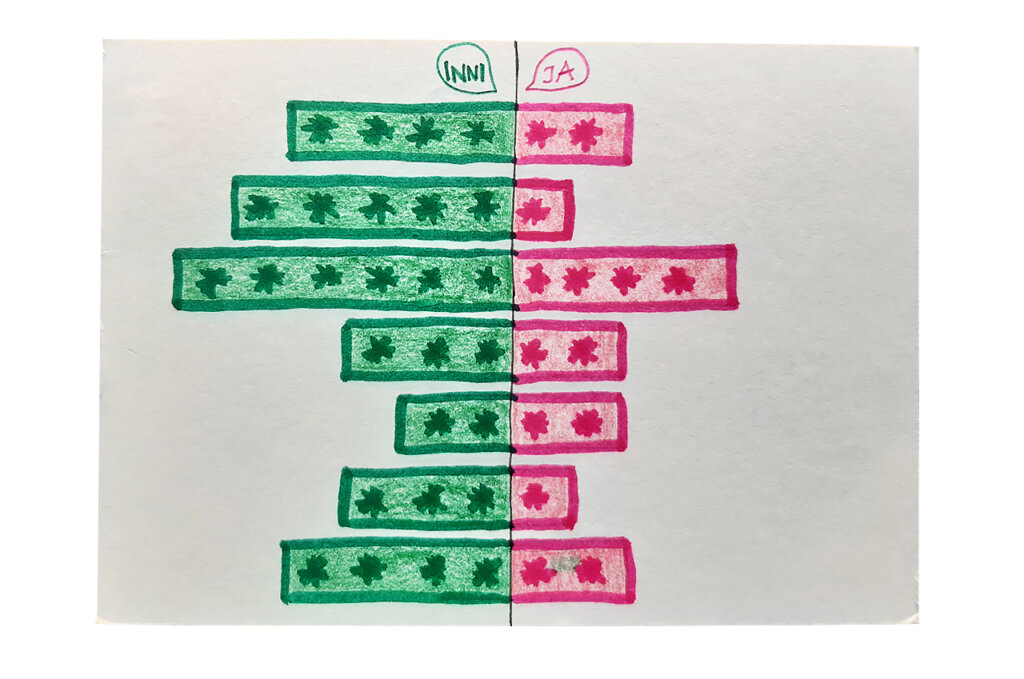
I like using the so-called diverging bar charts, so I showed the relationship between my own swear words and those from other sources.

Jakub’s postcard:

I love the idea of emotion outlets. When everything is in turmoil, sometimes we just have to let go of bad energy. Simple and clear!

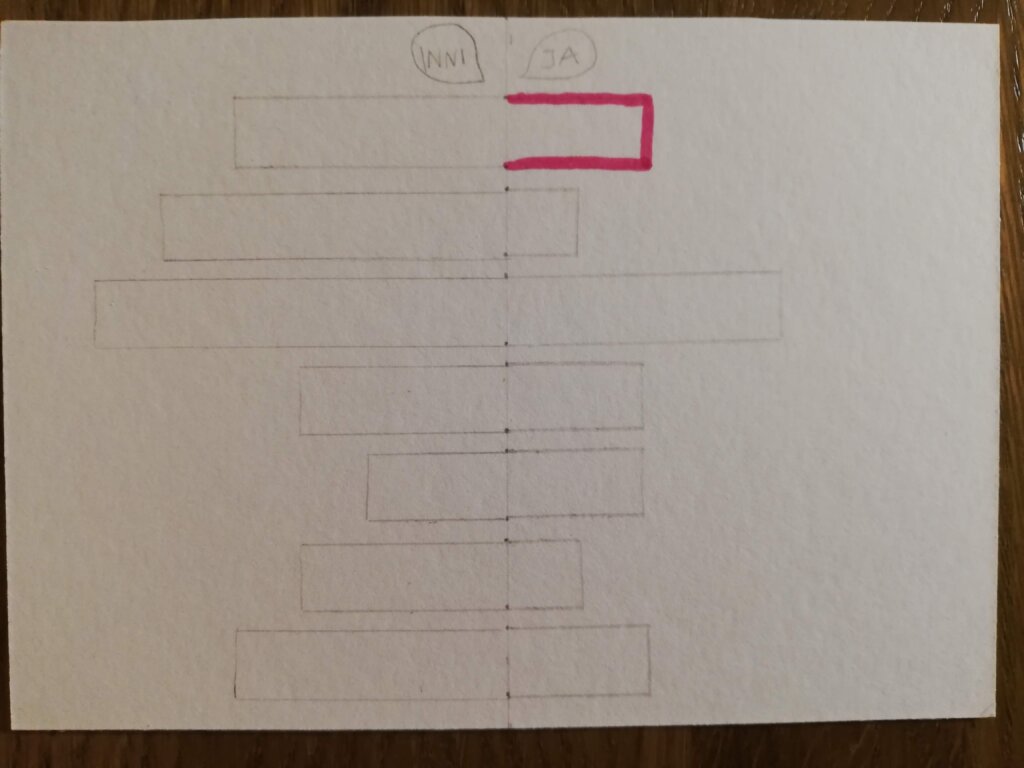
The process:
Categories
Uncategorized

Week 36

Jakub

Topic:
We live in a world full of choices. Just go to Zalando or Netflix. It’s no joke that choosing a movie or series to watch takes longer than actually watching it. There are also many decisions to be made at work. Should I stop working on this project? Should I write an email already? And so on and so forth. I expected this week to be rich in data.

Data gathering:
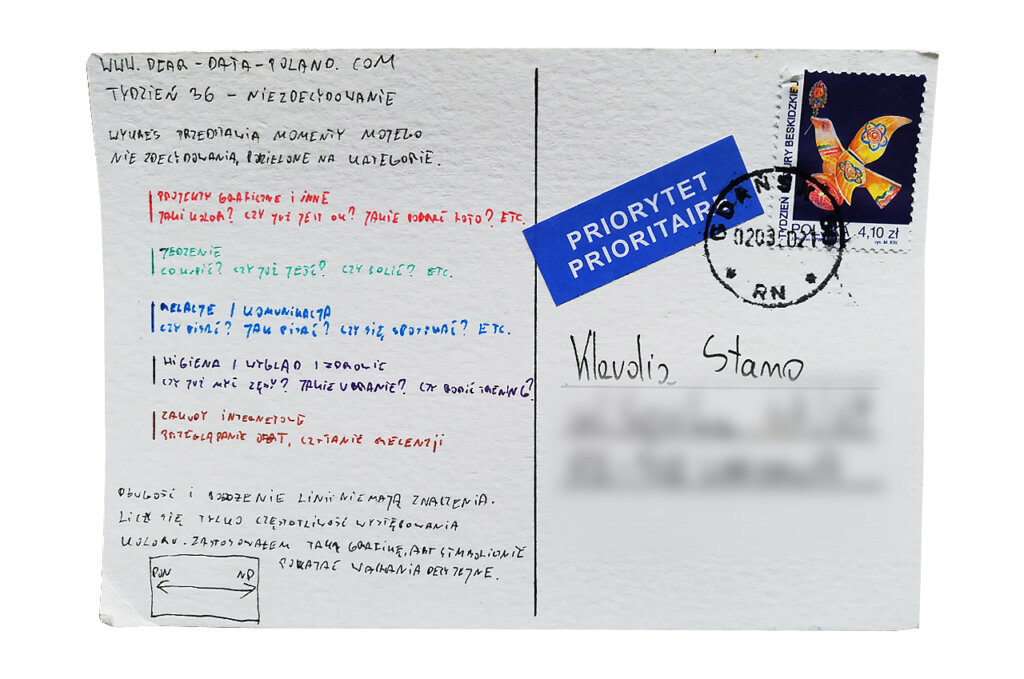
I used a proven system. I set up notifications on my phone every hour (except during the night) and wrote down every moment of indecision. Over time, five categories clarified. My indecision was related to:

  • creative work (e.g. details of graphic designs)
  • food (when and what to eat?)
  • relationships (should I write / call?)
  • hygiene and clothing (what to wear, when to take shower?)
  • related to shopping (browsing offers, reading reviews).

Data drawing:
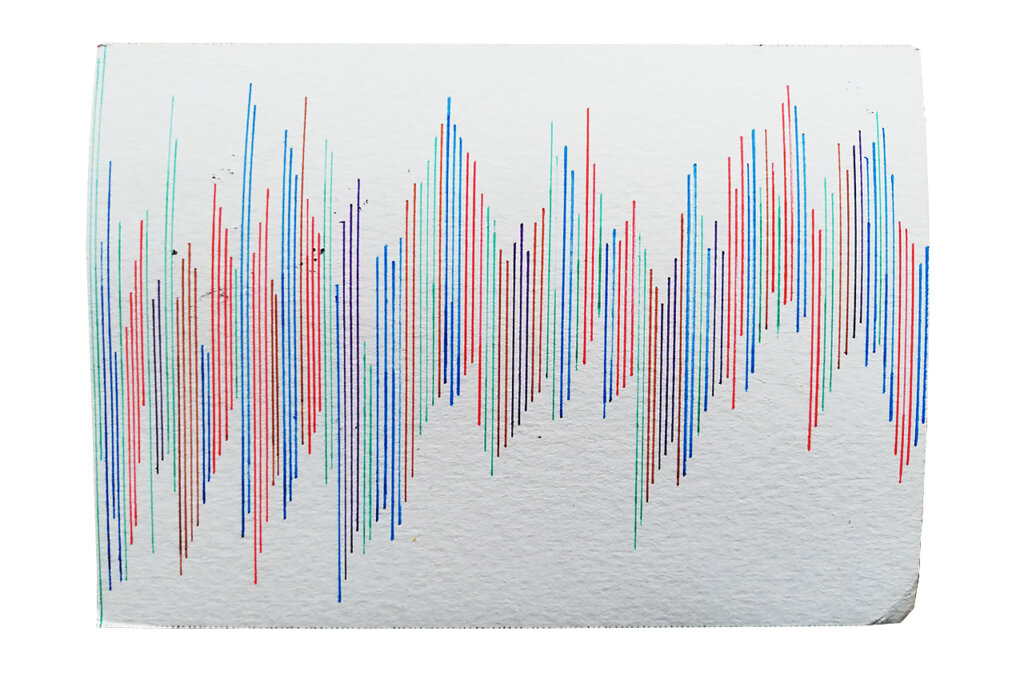
I gathered quite a lot of data. I have written down over 130 moments of indecision. While drawing the postcard, I had four different ideas. Ultimately, I decided to choose the artistic vision, which shows the diversity of my indecision moments. I had both important dilemmas (e.g. related to buying a new car) and trivial ones (e.g. what font to choose in advertising graphics). Ultimately, I mixed all data together. I hope that my postcard clearly shows that life is not simple and black and white.

Klaudia’s postcard:

Having children must be like having an extra job. I don’t have children myself, but Klaudia’s postcard clearly shows it. I like the everyday labyrinths. They illustrate well the subject of indecision. I am sure that Klaudia’s knowledge and experience play the role of Ariadne’s threads 🙂

The process:


Klaudia

Topic:
I was curious to see what this week would bring. Even though I hesitate a lot, my goal is to ensure that as many repetitive and trivial activities as possible in my life happen automatically. In this way, I do not have to remember about them and I spare energy to solve more interesting problems.

Data gathering:
The idea of detailed data collection terrified me, as I expected a tough week at work. I decided not to interrupt my focus with regular writing down of all hesitation moments. I just sat every evening and remembered all (or at least the majority of) major and minor decisions that I had to make during the day.

Data drawing:
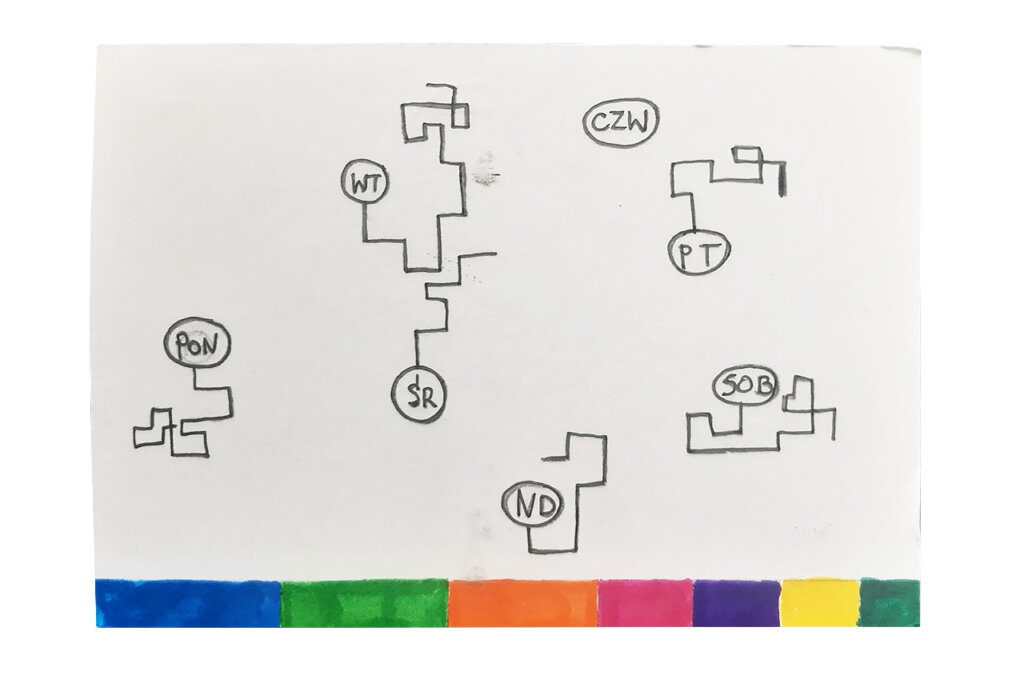
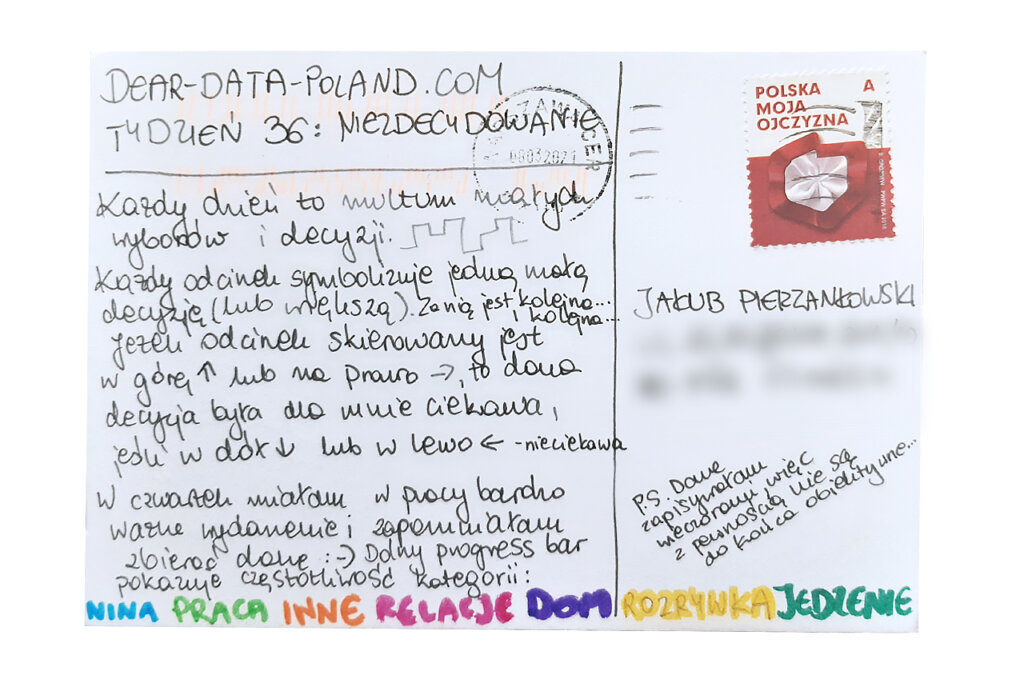
Initially, I had absolutely no idea how to present my indecision mishmash. After analyzing the data and breaking it down into topics, I observed that some decisions were interesting and thought provoking, while others were trivial or just boring. I decided to use this additional data layer.

On top of that, I wanted to show in my postcard that each day is a sequence of decisions.

And that’s how my postcard was created. I am not entirely satisfied with the outcome, but at least I tried something new 🙂

Jakub’s postcard:

It’s easy to see that Jakub collected data every hour, and I only collected data only once a day – he managed to save over 50 more records than I did 😉 

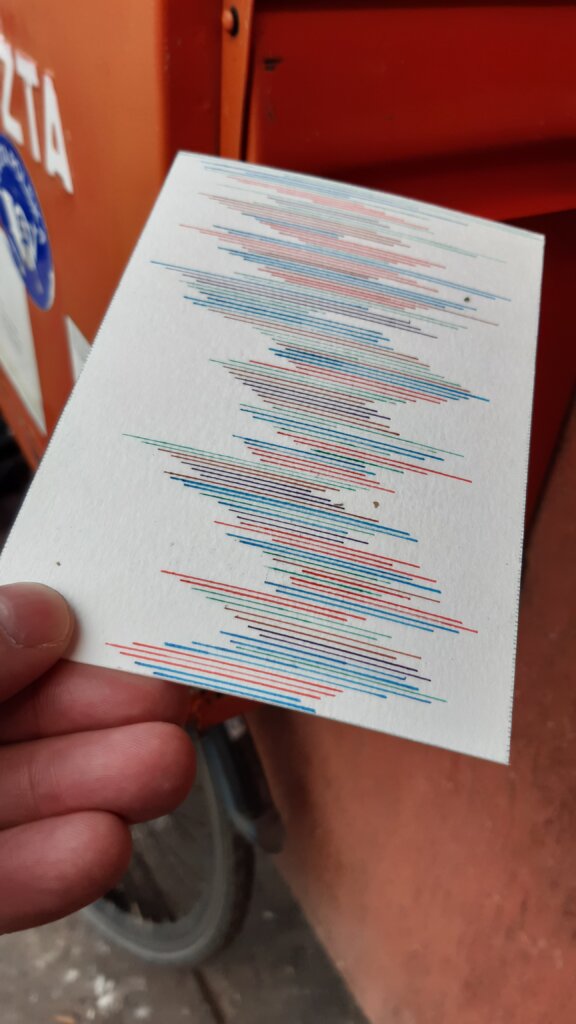
This postcard makes me think of sea waves. Moments of hesitation come and go like ebbs and flows. As soon as we deal with one problem, another one comes.

The process:
Categories
Uncategorized

Week 35

Jakub

Topic:
I am a minimalist when it comes to clothes. I use a so-called capsule wardrobe. Most of my clothes are black. Collecting data was very simple for me, and therefore enjoyable.

Data gathering:
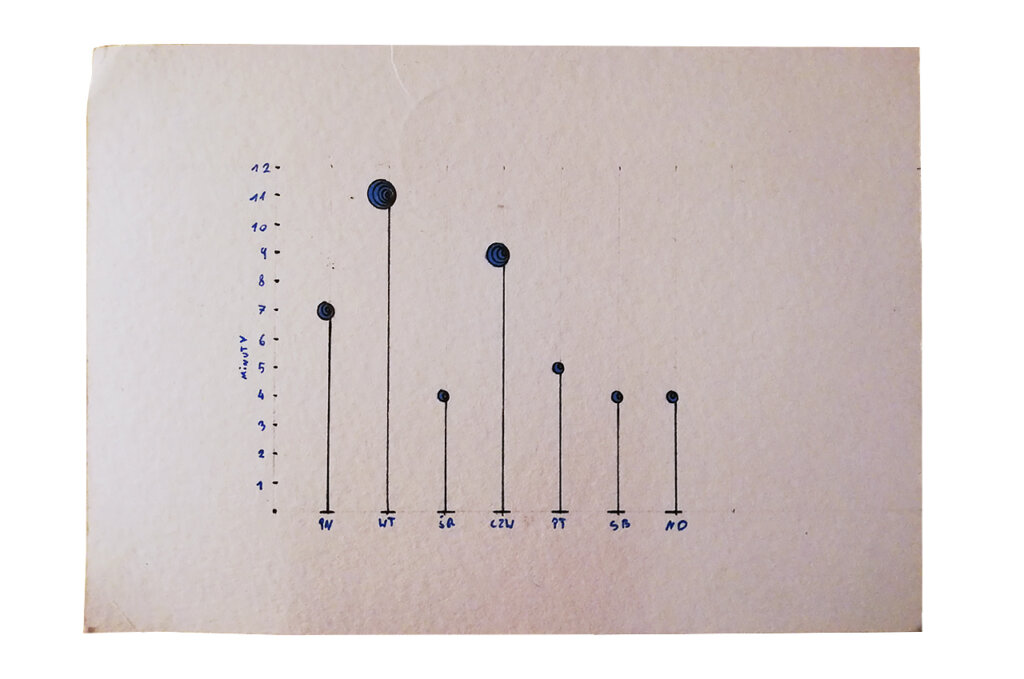
Every time when I started getting dressed (excluding shoes and my jacket), I would start a timer. In 4 out of 7 days I used only two sets of clothes, i.e. for work and after work. In the remaining three days, there were also outfits for running and shopping / walking.

Data drawing:
Just as my wardrobe is minimalist, I chose a minimalist column chart with an additional layer of data showing the number of “outfits”. The chart is black and navy blue like most of my clothes.

Klaudia’s postcard:

Klaudia’s postcard reminded me of one of my previous postcards from week 16 (theme “wardrobe”). Klaudia’s shoes obviously stand out. After all, they are essential in the mountains.

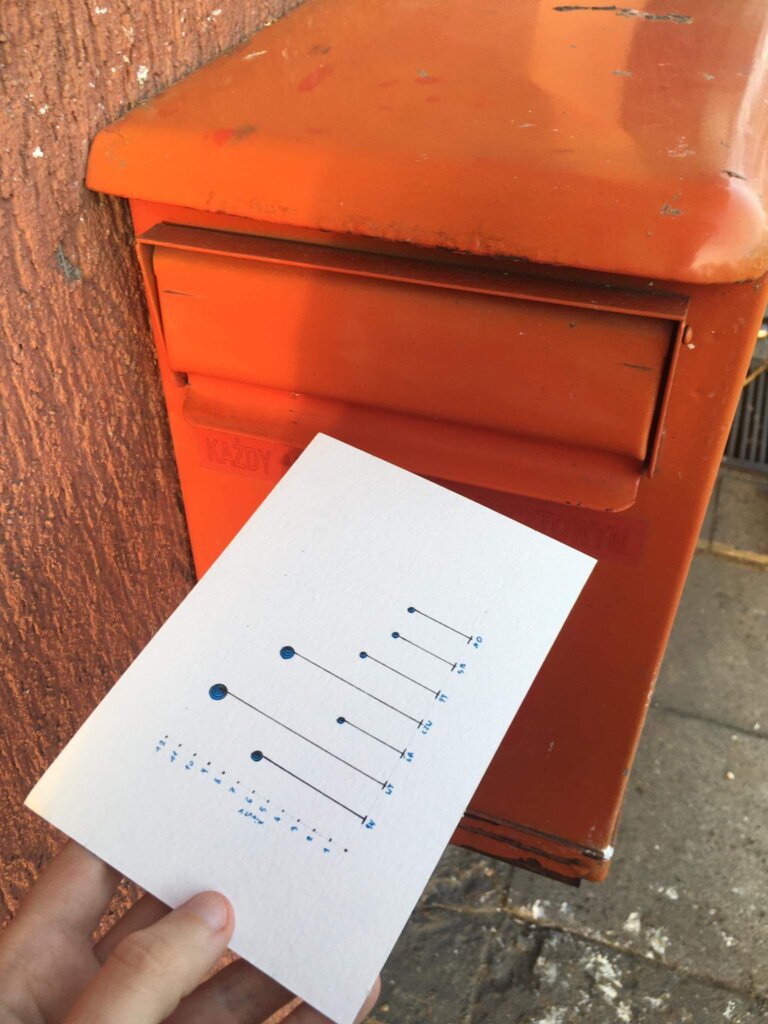
The process:


Klaudia

Topic:
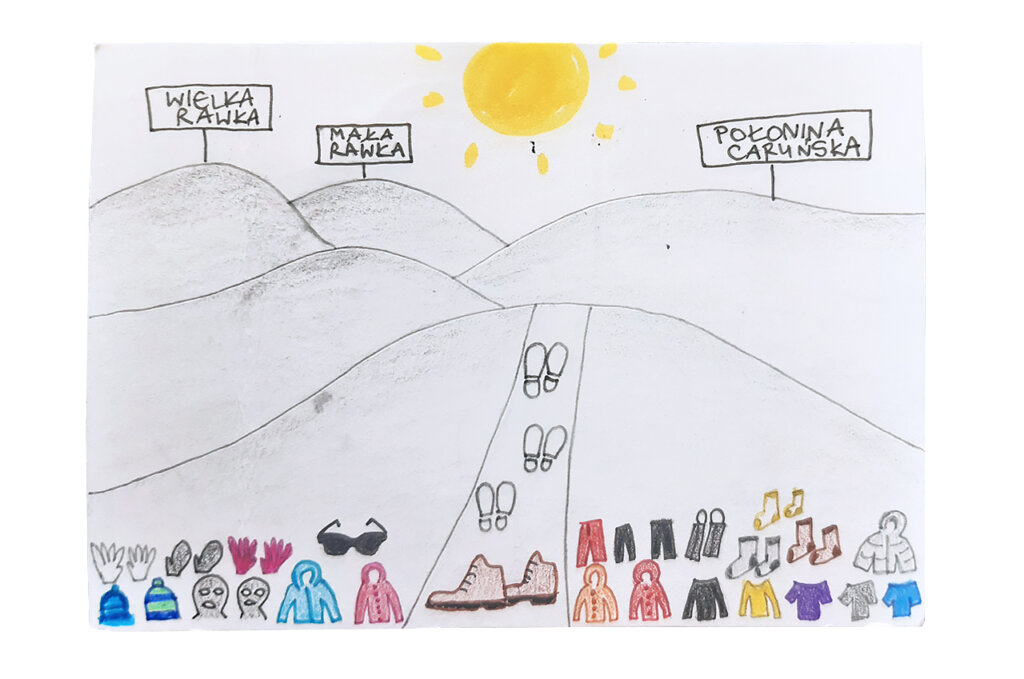
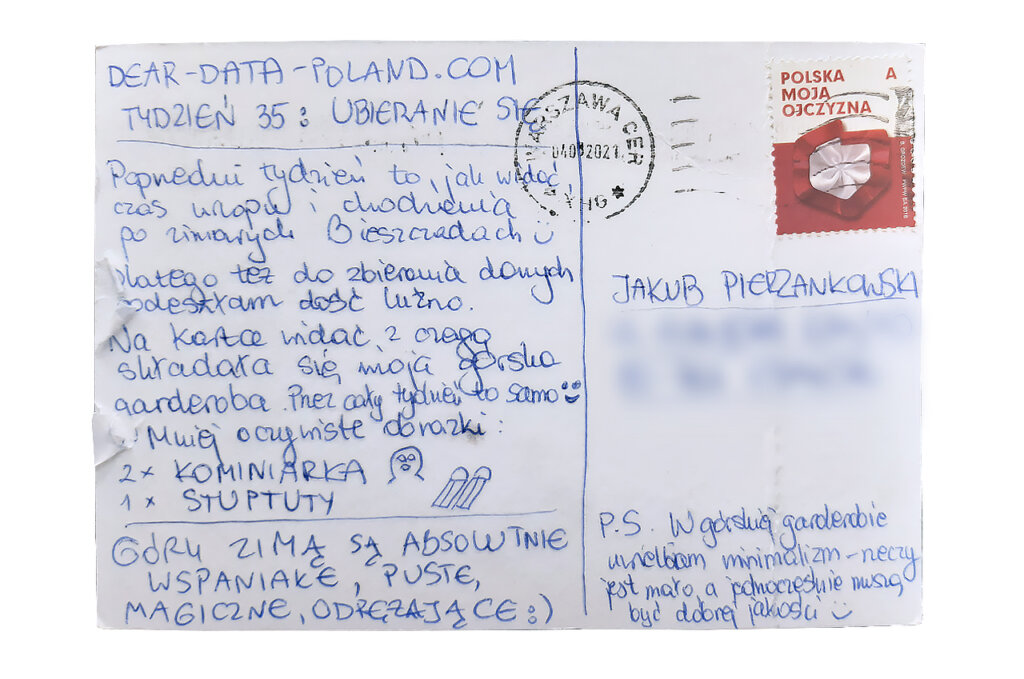
This week I was on vacation in the Bieszczady Mountains, where I only took a very limited number of clothes (exclusively sports outfits).

Data gathering:
Honestly, this week, due to my vacation, I wanted to take a break from the diligent data collection. I only noted down what I was wearing during the whole week of trips and thought that I would somehow draw it 🙂

Data drawing:
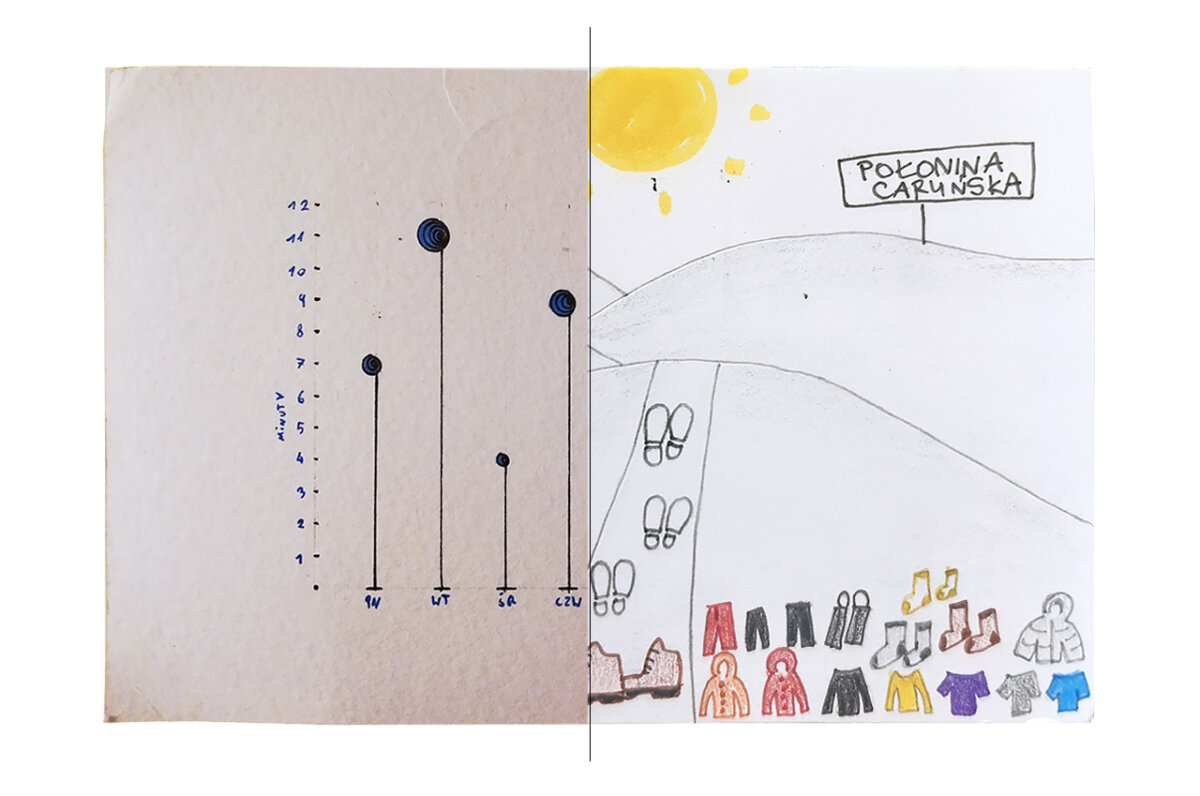
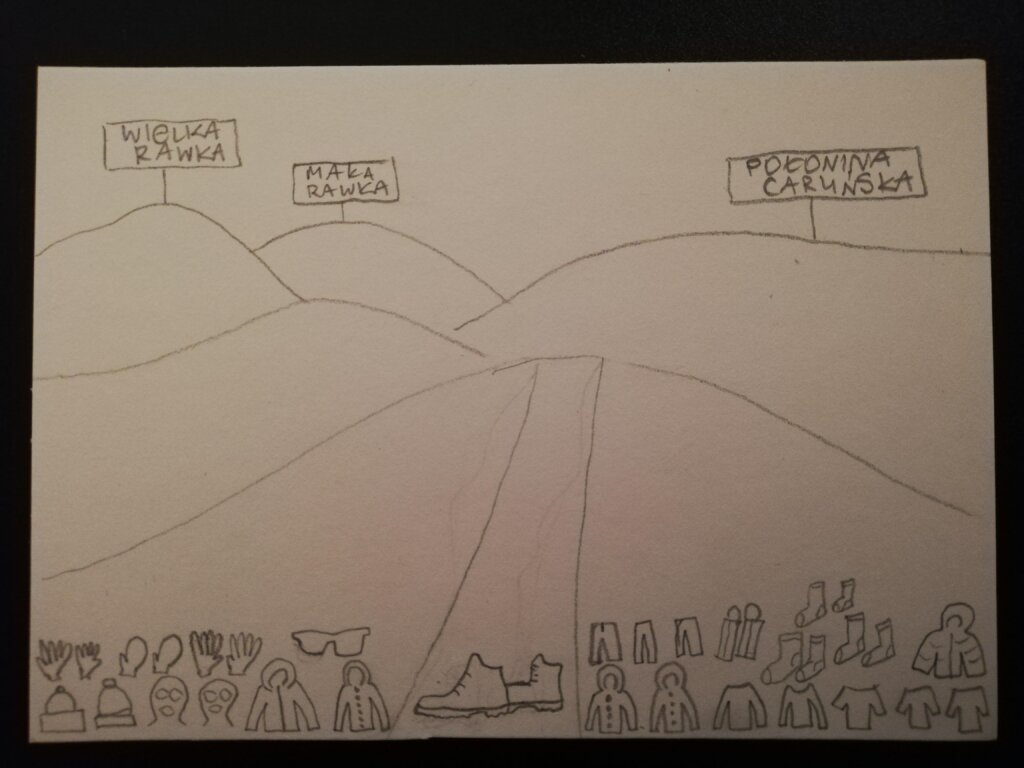
I wanted the postcard to present not only data, but also the climate of the Bieszczady Mountains. I wanted it to be a bit more pictorial than usual. At the very bottom, I have drawn all the clothes accompanying me during several trips, (Mała and Wielka Rawka, Połonina Caryńska). The hills in the background reflect the shape of the gentle slopes of the Bieszczady Mountains.

Jakub’s postcard:

I admire the idea of measuring dressing time, I probably wouldn’t have thought of that. I’m curious what led Jakub to change his outfit so often on Tuesday!

The process:
Categories
Uncategorized

Week 34

Jakub

Topic:
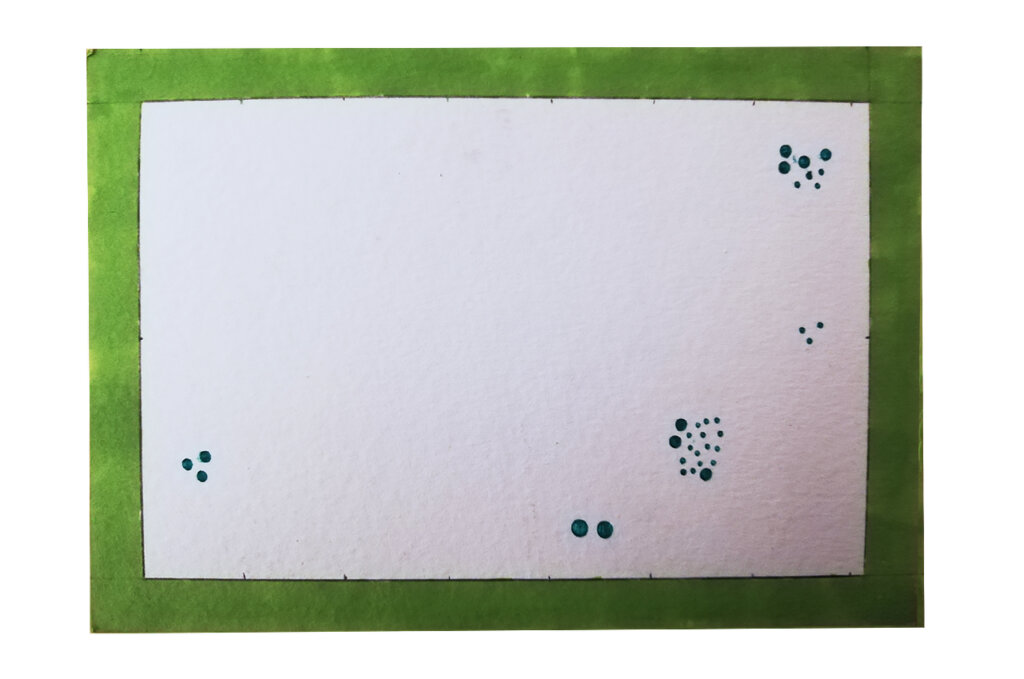
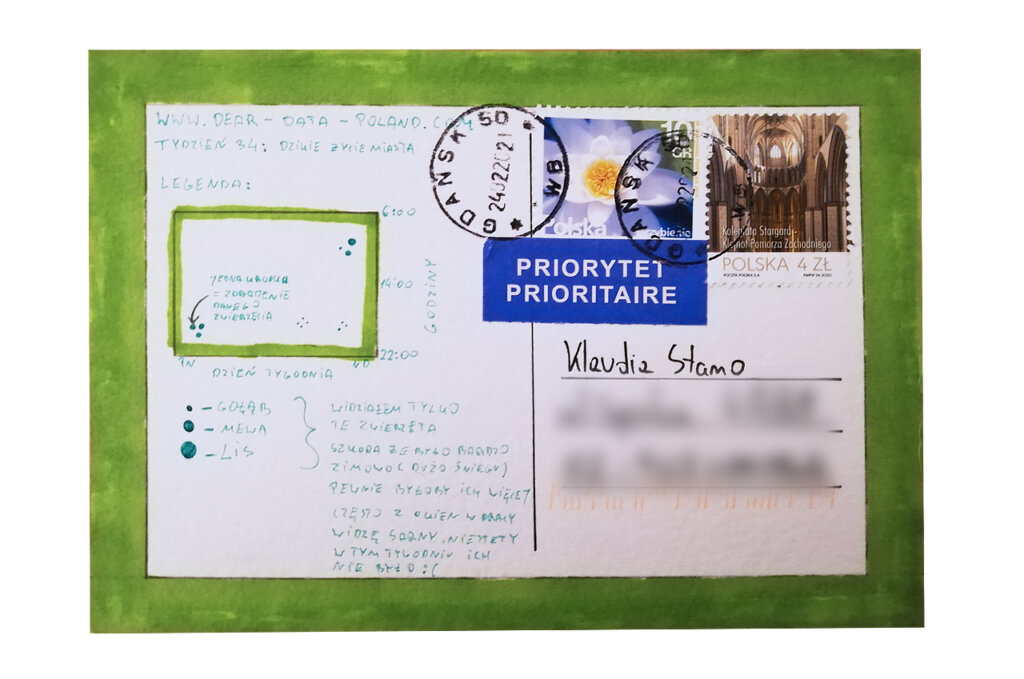
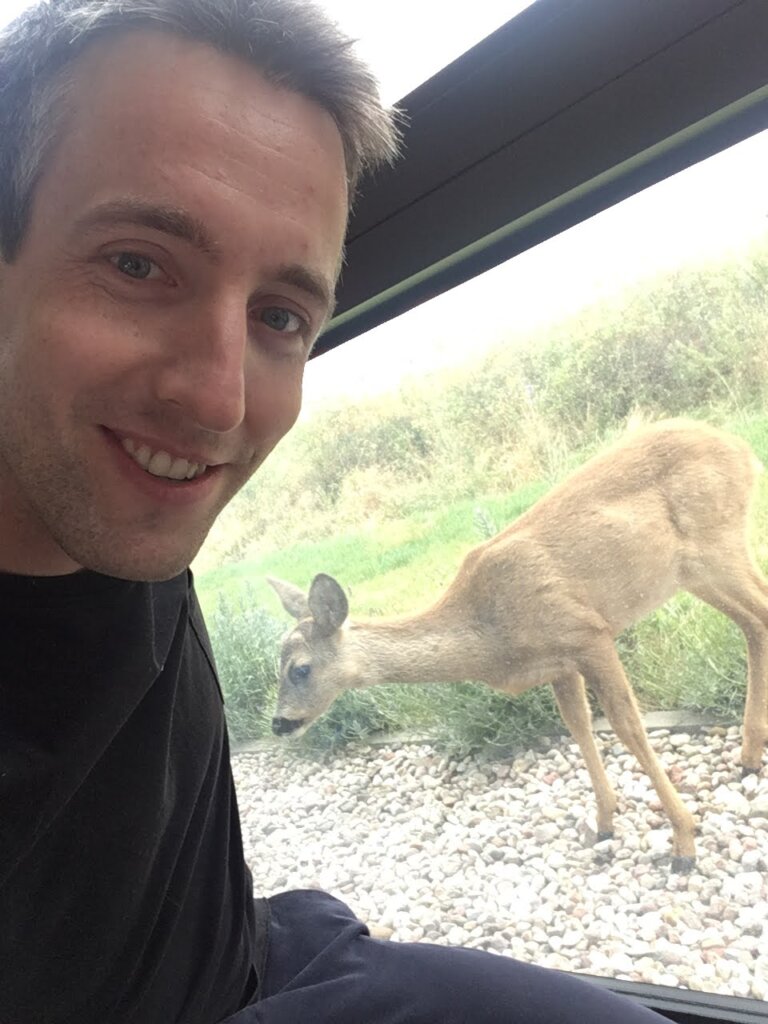
I waited for this week because I felt that I would have something to boast about. Deer come to the windows of my office very often (photo below). I already got used to them. Unfortunately, last week they did not appear 🙁 It was a very cold week. Low temperatures and snowfall did not favor people and animals, but I still managed to collect some data.

Data gathering:
I waited all week for deer, but I also watched out for other animals. I saw seagulls, pigeons and… a couple of foxes at the Shakespeare Theater in Gdańsk.

Data drawing:
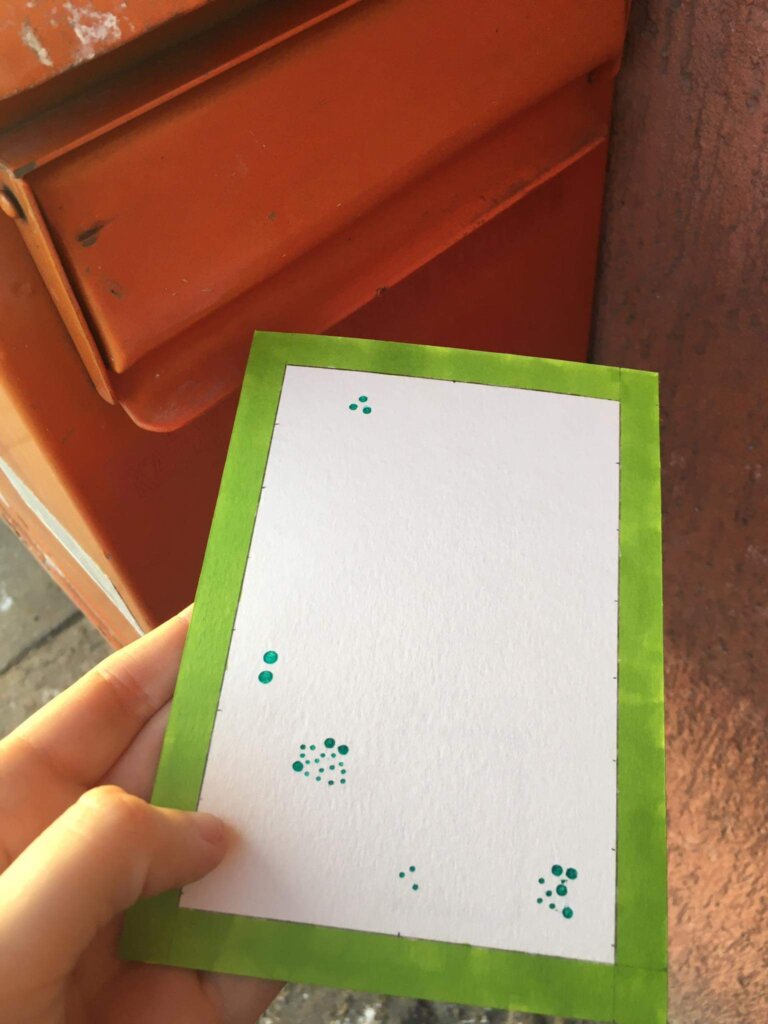
The green border symbolizes the wild and mysterious area of animals, but sometimes animals travel to our urbanized (white) areas where we can observe them. All in all, I’m glad the weather was not that good this week. The life of wild animals in the city is so rich that with good weather I could have trouble processing all the data. 

Klaudia’s postcard:

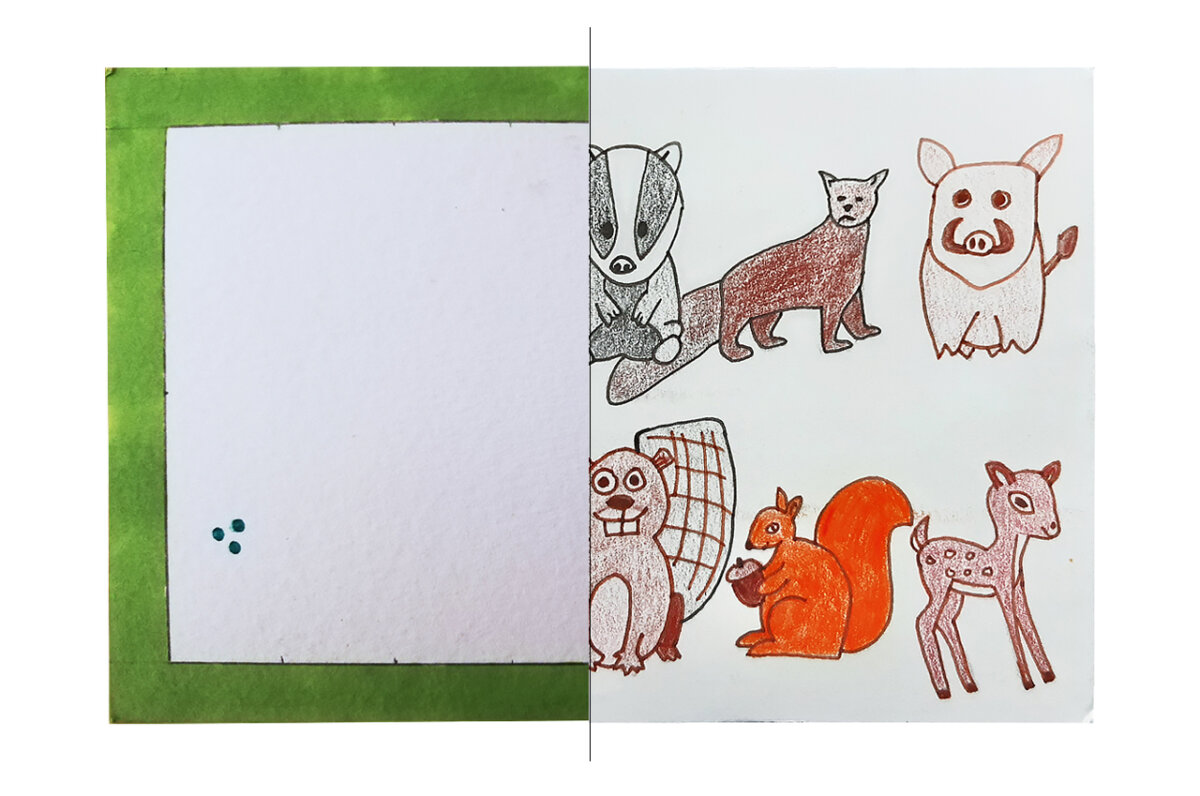
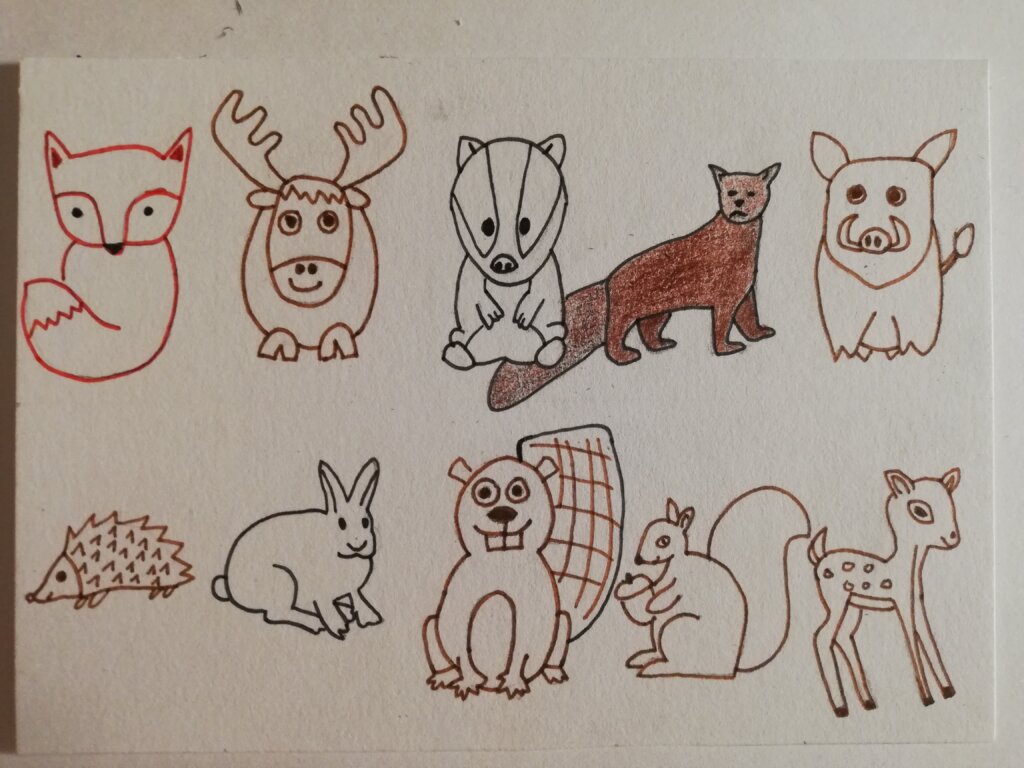
Klaudia’s postcard made me smile. Surely drawing it must have been fun. It also has an educational value. Until now, I associated Warsaw mainly with wild squirrels.

The process:


Klaudia

Topic:

Although I love spending time in nature, it is not so important for me in Warsaw. Probably because my focus here is on work and everyday life. I have been waiting for this week from the beginning of the project. I wanted to observe my surroundings more carefully.

Already on the first day I thought that nature observations would be difficult this week due to the thick layer of fresh snow lying on the streets. I was right. All week long I saw only birds – mainly pigeons and crows, animals that arouse the least of my curiosity. I spent seven days and more thinking how to design my postcard.

Data gathering:
During the week, I wrote down the birds I saw and the time of day. However, at the end of the week I decided not to use my data… They were just so boring for me. 

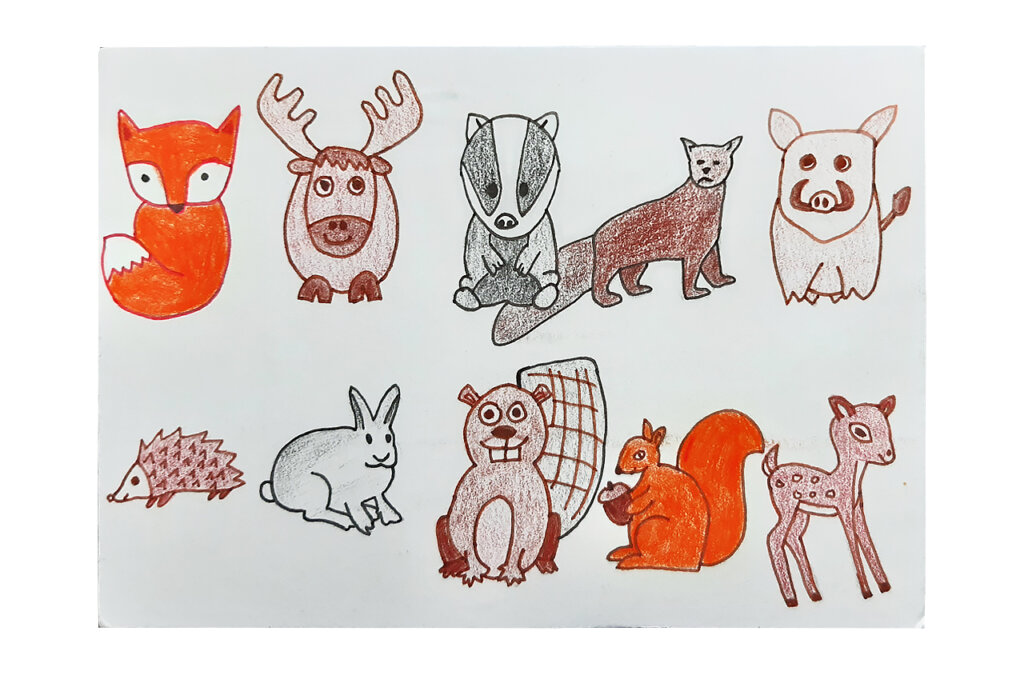
I started typing in browser terms such as “wild nature in Warsaw” in search of inspiration (even if they did not refer to the past week). I thought I might learn something new about my city. Initially, I wanted to present data on protected reserves, but finally I found the list of wild animals that can be encountered in Warsaw (even if not often). And I liked it!

Data drawing:
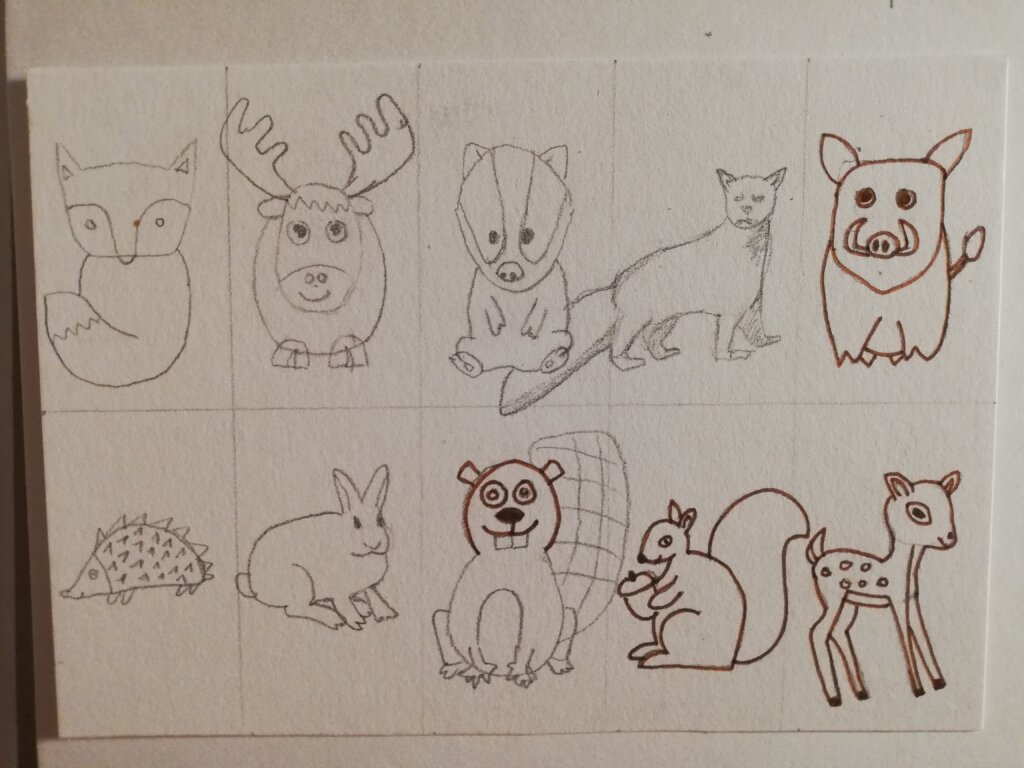
I really felt like drawing these animals. It was a huge challenge for me. I used the Internet where I was looking for tips on “how to draw a squirrel”, “how to draw a pine marten”. I am probably the most proud of the beaver, roe deer and badger.

Jakub’s postcard:

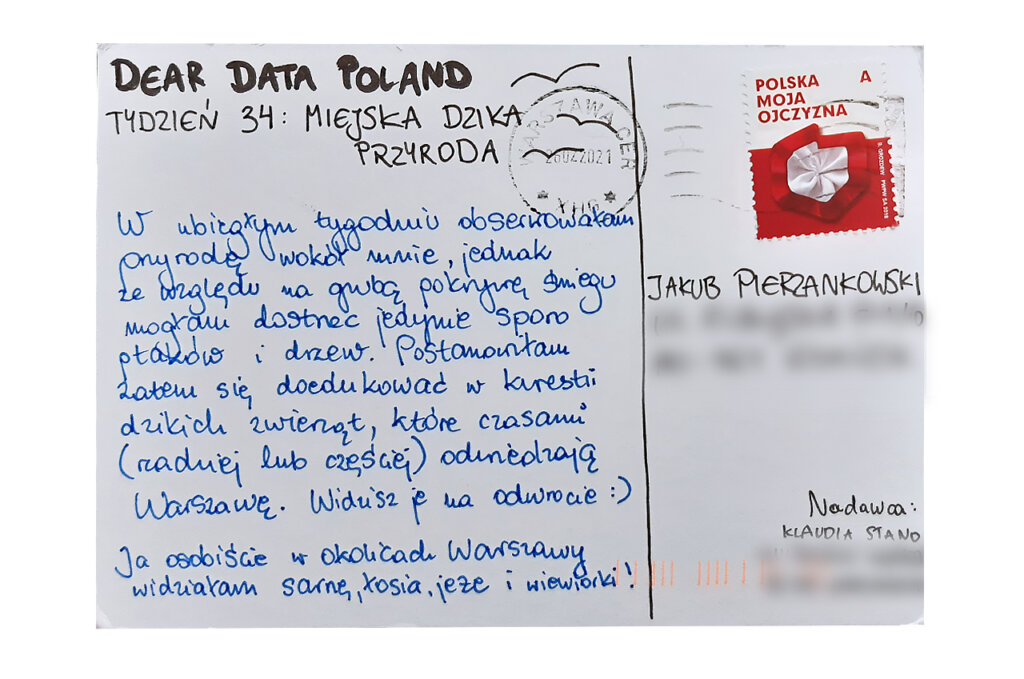
Before reading the legend I tried to decipher the meaning of the postcard. I didn’t succeed, but I really liked the green atmosphere of Jakub’s postcard and the fact that the data resemble traces of animals 🙂

The process:

Categories
Uncategorized

Week 33

Jakub

Topic:
I try to approach the subject of envy reasonably. It brings me more good than harm. I don’t remember any moment when my jealousy was destructive for me or my loved ones. However, I know that jealousy very often causes bad behavior. Fortunately, jealousy has not blinded me so far.

Data gathering:
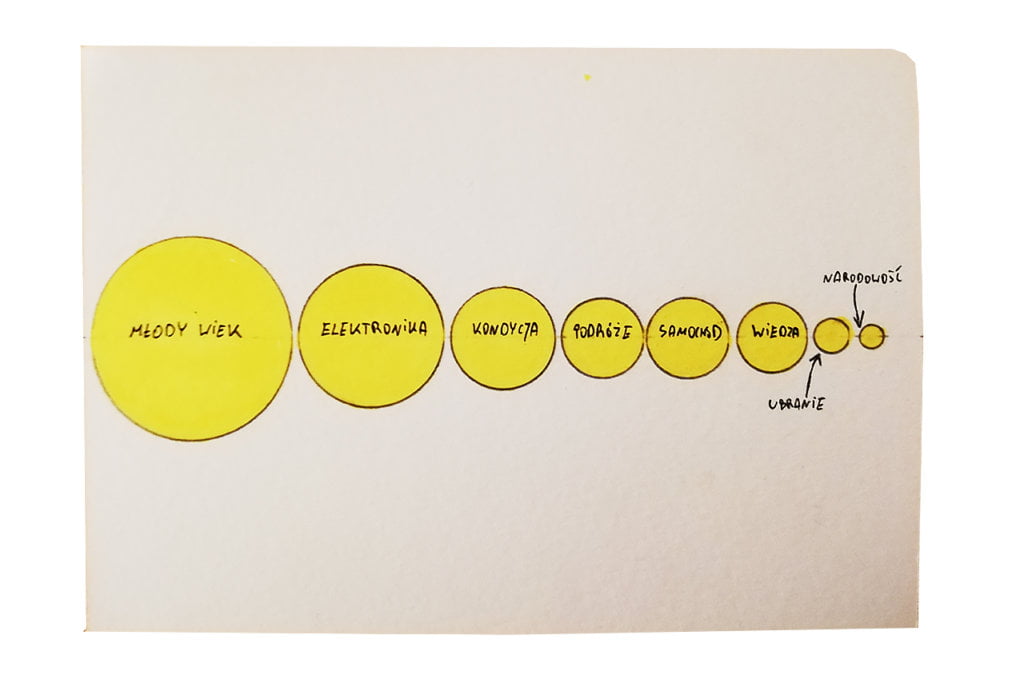
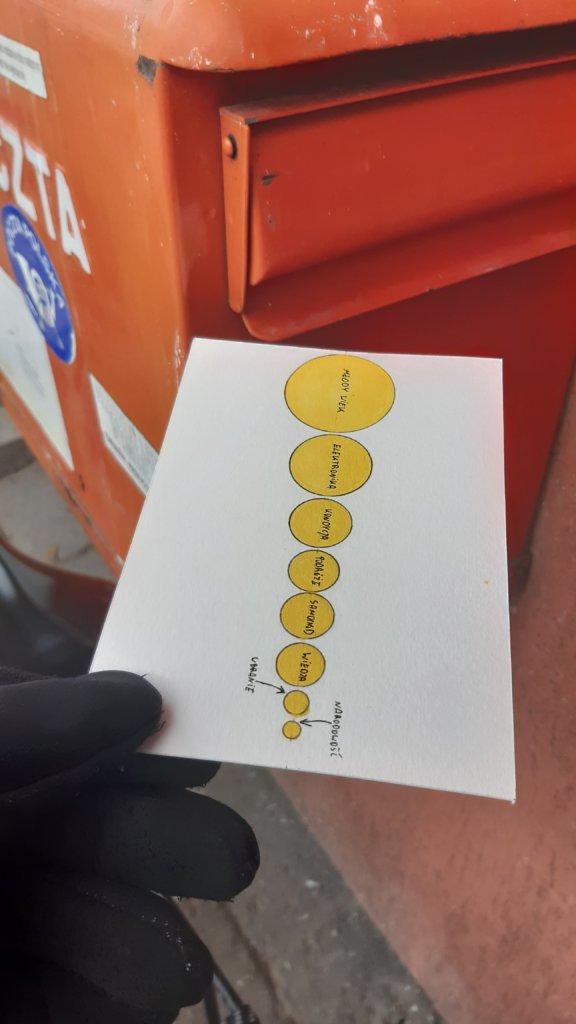
As in the previous weeks, before falling asleep I listed all the feelings of jealousy that happened to me that day. Fortunately, there weren’t many of them. Since I had a particularly large number of contacts this week with people much younger than me, I mostly envied their young age.

Data drawing:
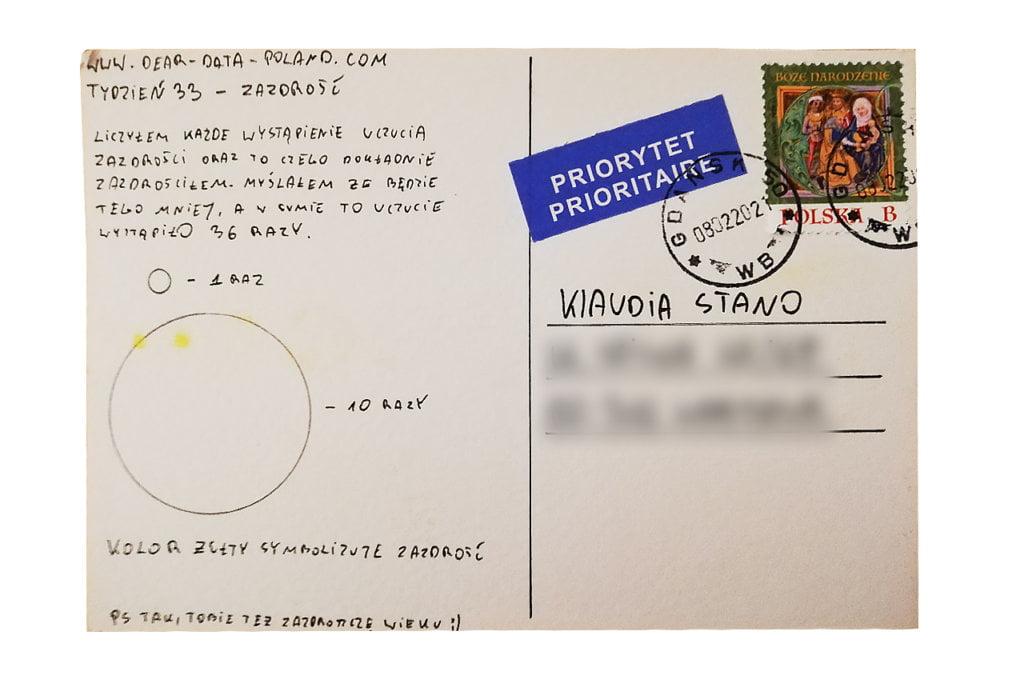
Simplicity. I went back to my favorite circles to show the intensity of my feelings in various categories. The graph is very minimalistic, but I think it’s clear. Not accidentally, I used yellow. Somewhere I found that this color represents jealousy.

Klaudia’s postcard:

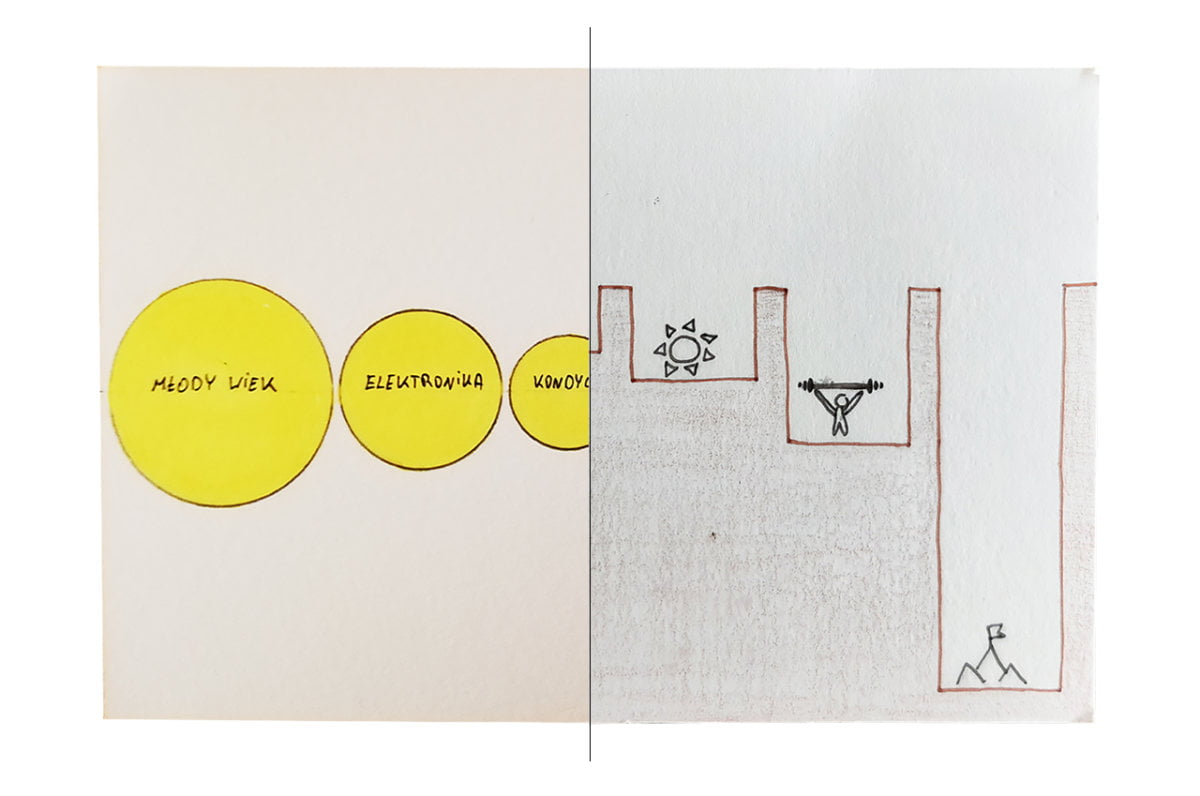
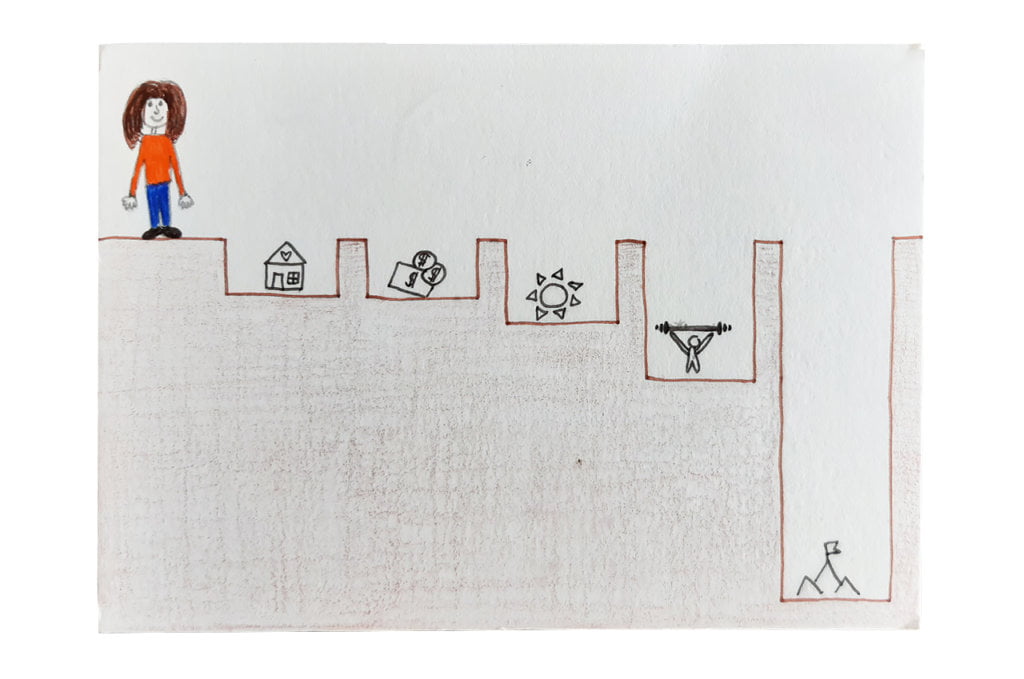
Klaudia’s card, like mine, is minimalist, but it has one additional value – metaphorical “jealousy holes”. Meaningful. Bravo for the idea.

The process:


Klaudia

Topic:
Interesting topic… I think in the past I used to feel jealous more often. Especially when I did not know what I was aiming for and what was my priority in life. Today I have greater acceptance for myself. I also try not to compare myself to others, but only to myself from previous days.

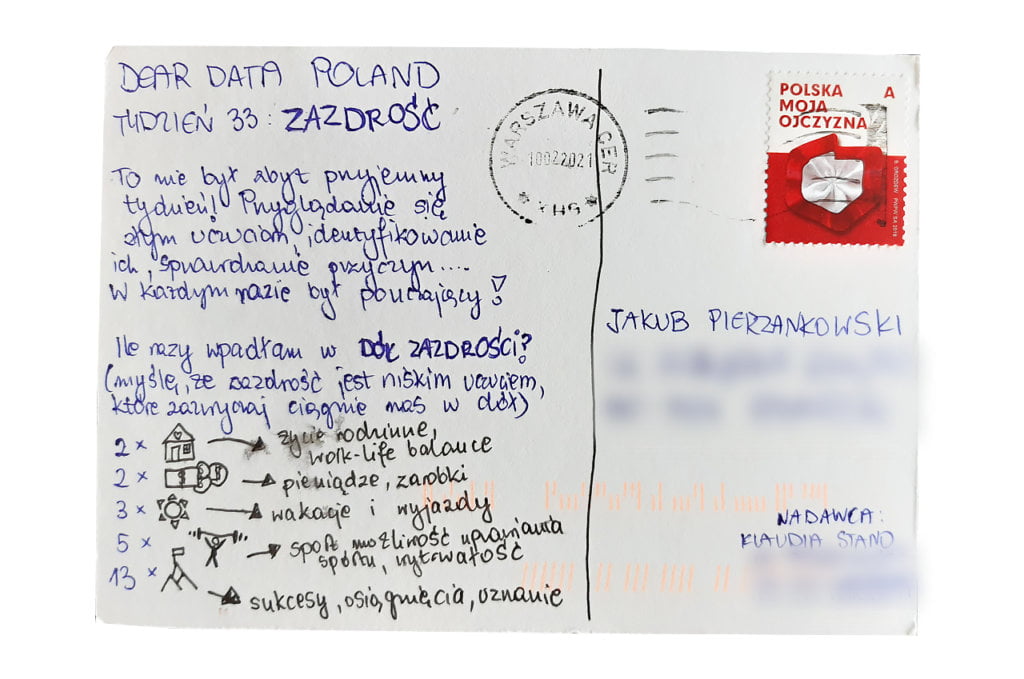
I never thought about how often I feel jealous. I suspected that most often I envy people their achievements and successes, and it turned out to be true.

Data gathering:
I tried to catch every pang of jealousy and write it down right away in my notebook. Maybe I missed something, but I tried to be careful. Interestingly, about ⅓ of the collected data comes from social media.

Data drawing:
The idea came exceptionally quickly. I started to wonder what I associate jealousy with and how I perceive it. Is it empowering or, on the contrary, depressing? It is by all means the latter, so I immediately thought of the “holes” I fall into whenever I feel unhealthy jealousy.

Jakub’s postcard:

At first I was very surprised when I took the postcard out of my mailbox. Was Jakub really so jealous of other people’s age? After all, he is still so young 😉 I was intrigued by the fact that most of our categories differed, and the overlapping ones were arranged in a completely different order. I was really surprised, but I realized that jealousy is a feeling not often discussed with others, even with friends. 

I like the card visually very much. I know that Jakub likes circles and their use in this context is well-suited and clear.

The process: