Categories
Uncategorized

Week 52

Jakub

Topic:
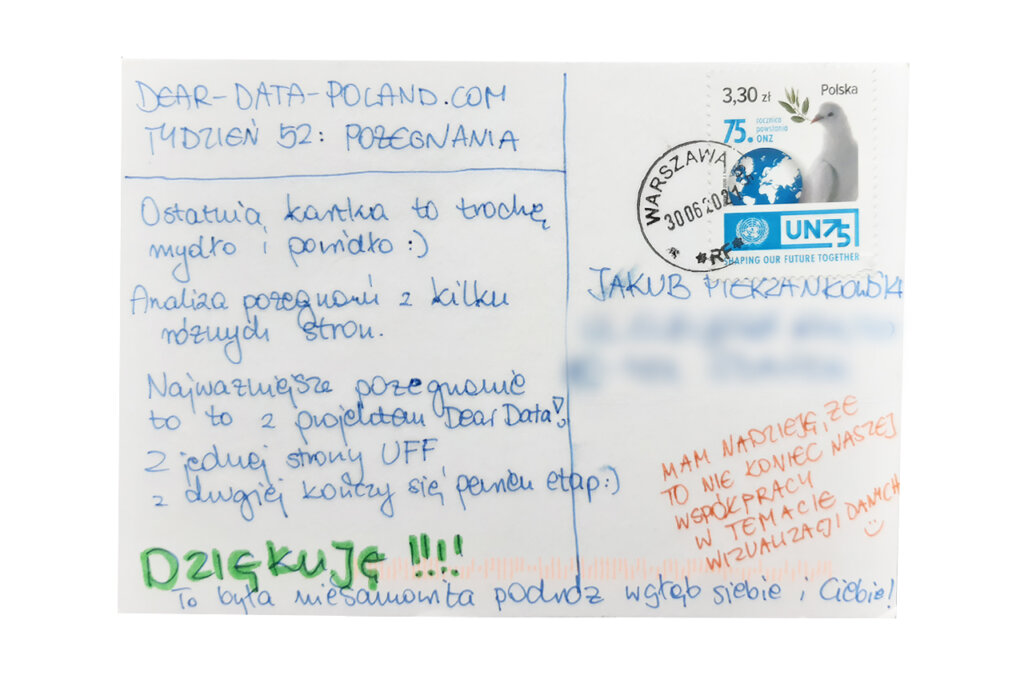
Goodbyes. The Dear Data Poland project was a very interesting experience for me. It tested my creativity. My mind has been working at a higher speed all year long. Collecting data can be very painful and tiring, as well as searching for visualization ideas. I am not fully satisfied with most of my postcards, but it was worth it for the few favorite pieces. 

Thank you very much to Krzysztof for picking up the idea to start the Polish edition of Dear Data and to Klaudia for replacing Krzysztof and saving this project. I hope we will remember the project our whole lives.

Data gathering:
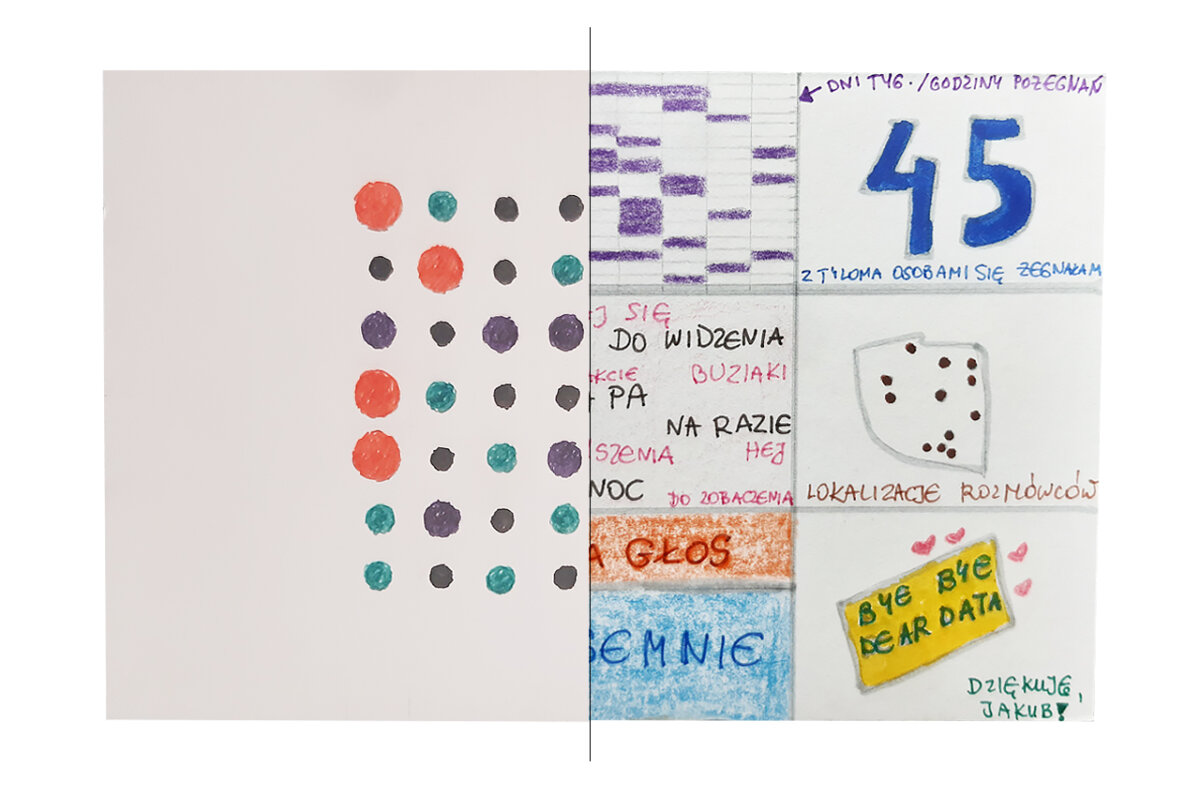
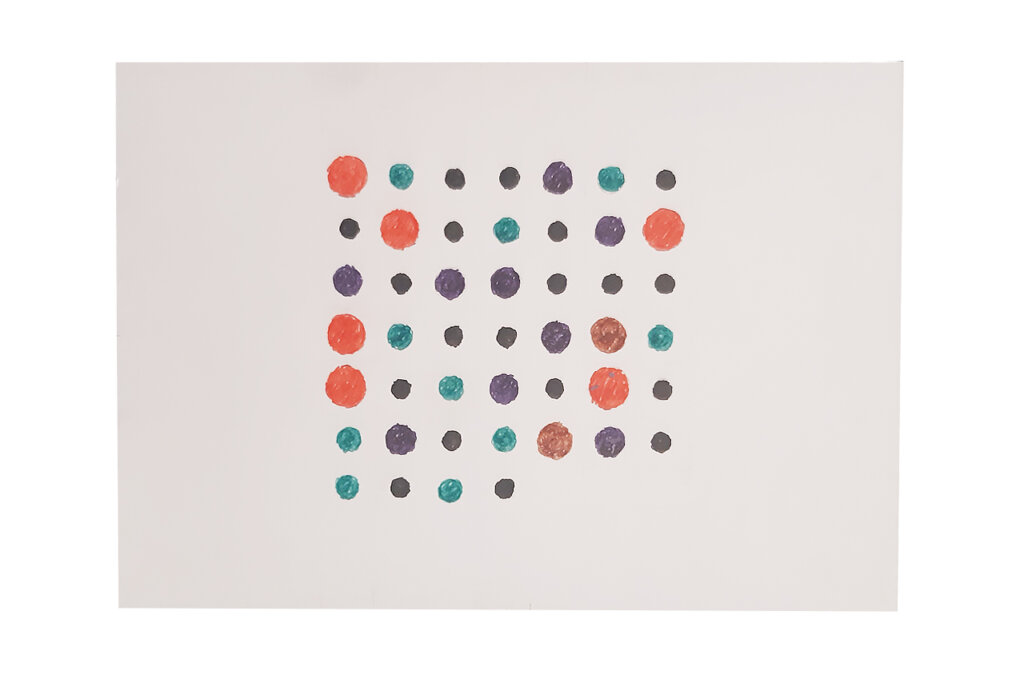
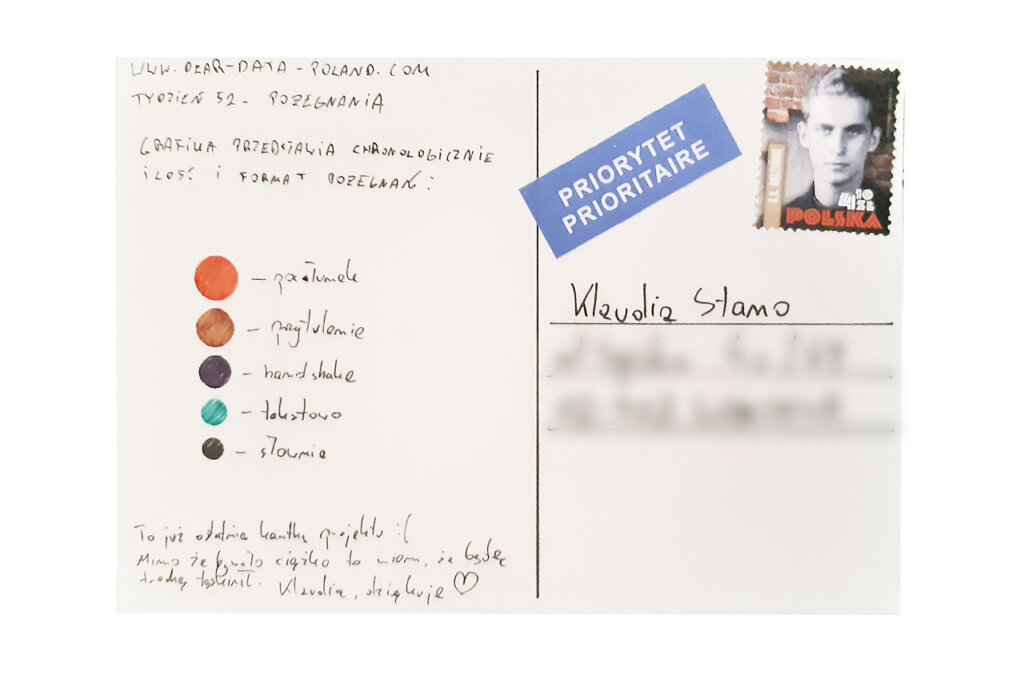
I approached last week’s subject literally. I counted and categorized all goodbyes. They were kisses, hugs, handshakes, words or text.

Data drawing:
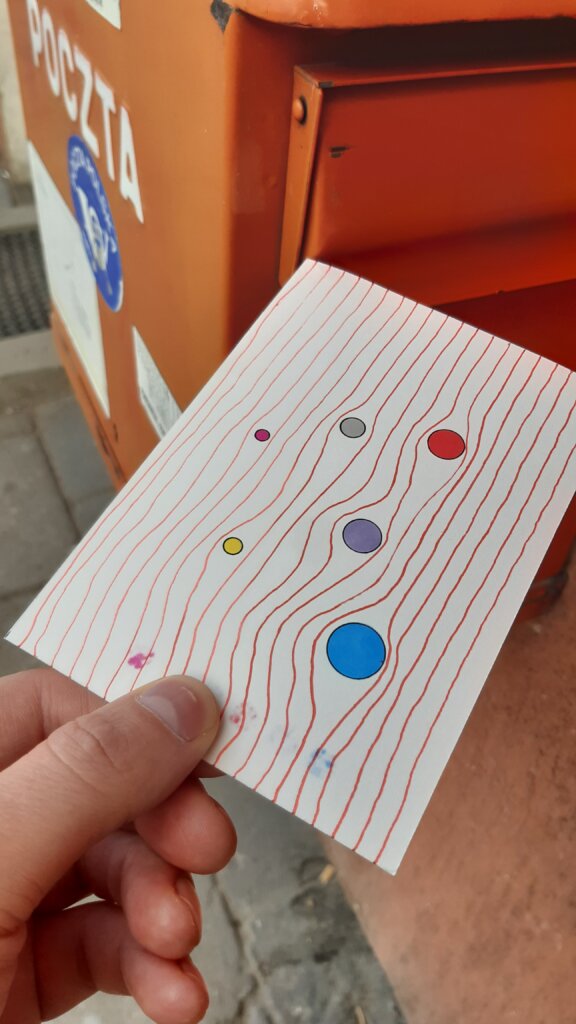
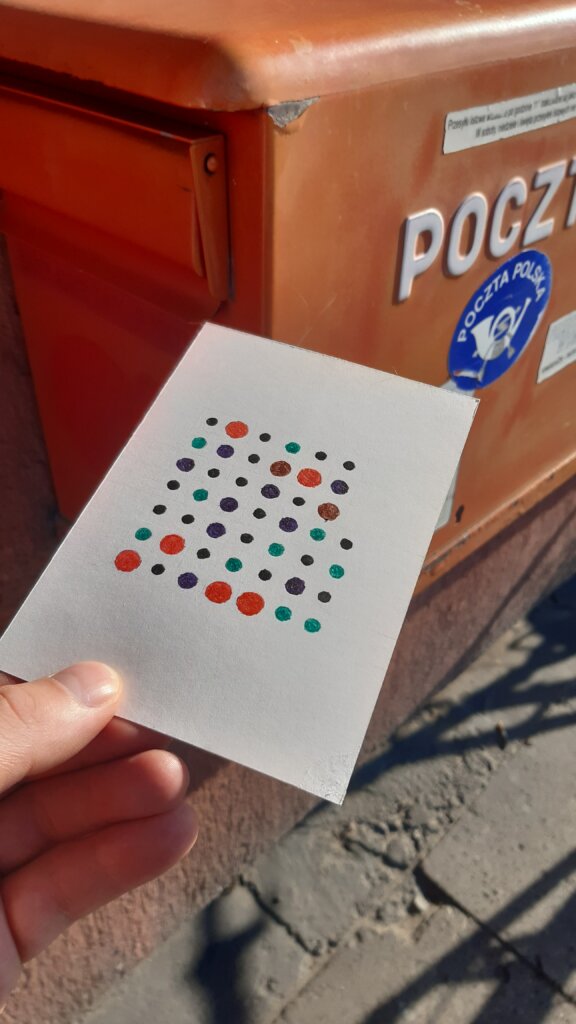
My postcard shows the chronology of all goodbyes throughout the week. The larger the symbol, the more tender farewell.

Klaudia’s postcard:

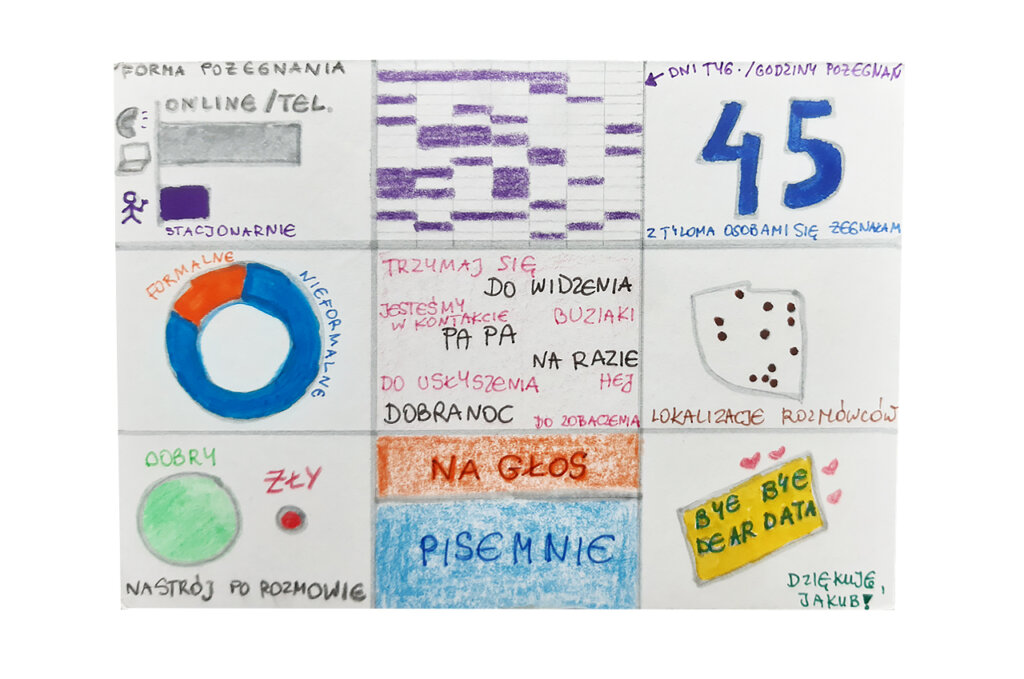
Klaudia approached the topic similarly, but more in-depth. Klaudia, take care, we stay in touch, see you later;)

The process:


Klaudia

Topic:
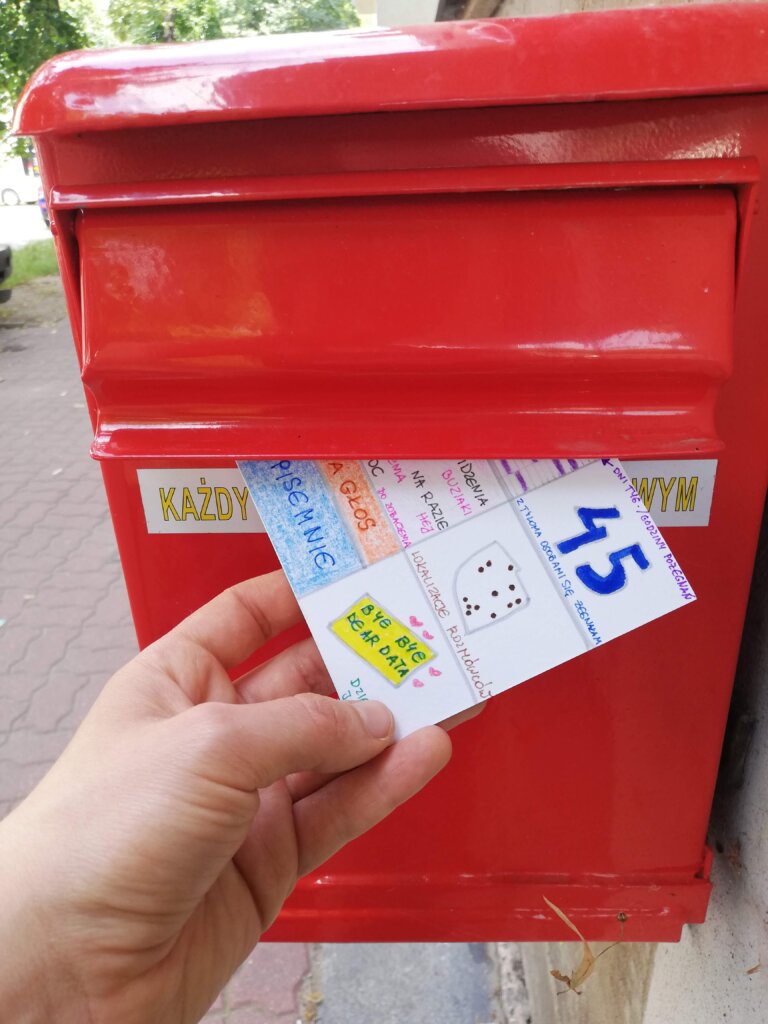
Oh no, Dear Data is over. Or maybe should I finally relax and enjoy this moment? 

On one hand, I don’t want to say goodbye. Dear Data was always an interesting and creative part of the week. On the other hand, I have experienced how hard it is to constantly collect data of some sort and create postcards regularly. There were crises, but the sight of a new colourful postcard in my mailbox compensated for the time and effort involved. I find our gallery truly impressive.

Data gathering:
There were many more goodbyes this week. I wrote them down in my notebook or on my phone. I hope I didn’t miss more than 10% of goodbyes.

Data drawing:
The last postcard deserved more than one chart. Goodbyes have many faces. They are held at different times of the day. Sometimes they are very formal, sometimes affectionate. There were times when I ended up in a bad mood after saying goodbye. And although I spent the whole week in Warsaw, I greeted and said goodbye to people from all over Poland. The postcard shows it all. It’s a mish-mash, but it was supposed to be this way.

Jakub’s postcard:

I knew that Jakub would finish the project with circles 🙂 It couldn’t be otherwise! I like the strong, red emphasis on kissing goodbyes.

Jakub, we made it! See you! Who knows, maybe we will carry out another project together.

The process:
Categories
Uncategorized

Week 51

Jakub

Topic:
Privacy. I feel like this word will be on everyone’s lips in the near future. A lot of people do not realize how much valuable data they leave as their digital footprint. OSINT (open-source intelligence) is developing quickly. Technology giants remind us every now and then to carefully secure our accounts, for example through two-factor authentication. In spite of this there must be probably a huge fuck-up for us to take a closer look at the data we leave on the internet.

Data gathering:
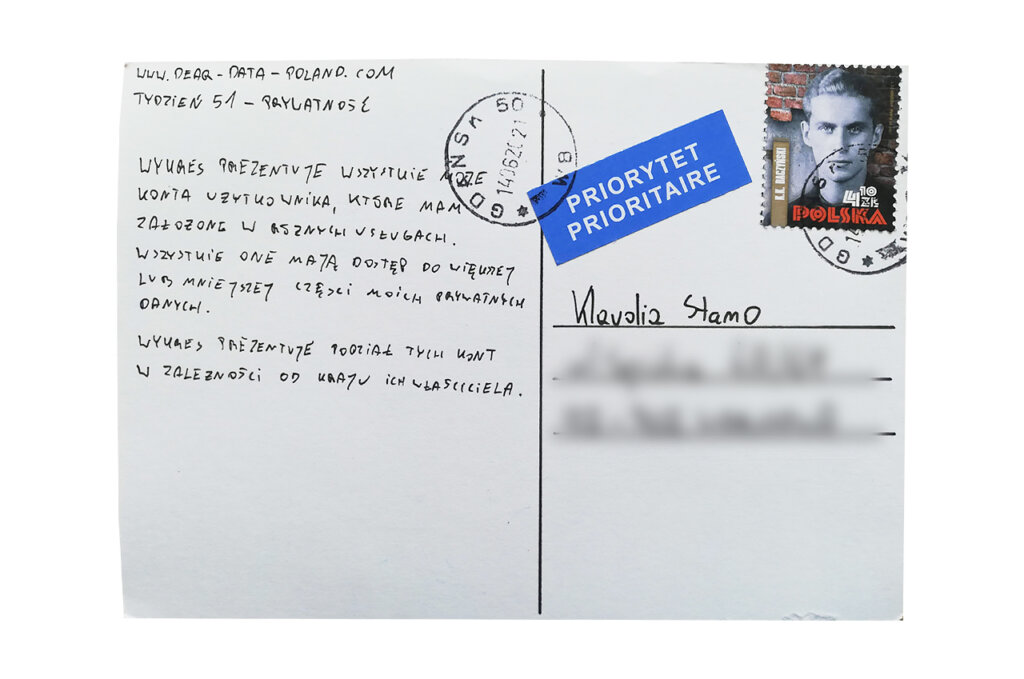
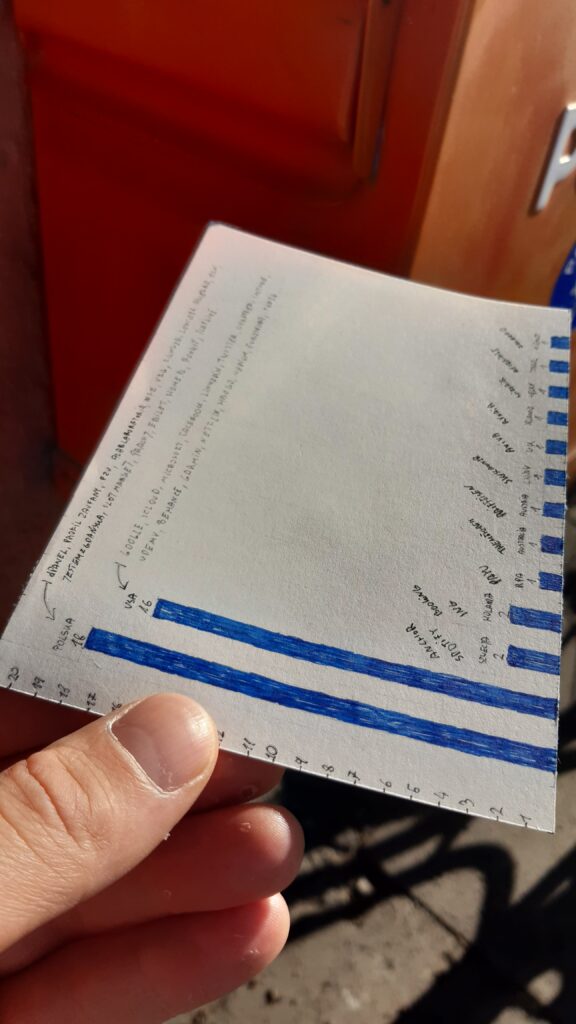
For at least two years I have been keeping a detailed record of my various user accounts. And most importantly I try to limit their number. I decided to use this data this week.

Data drawing:
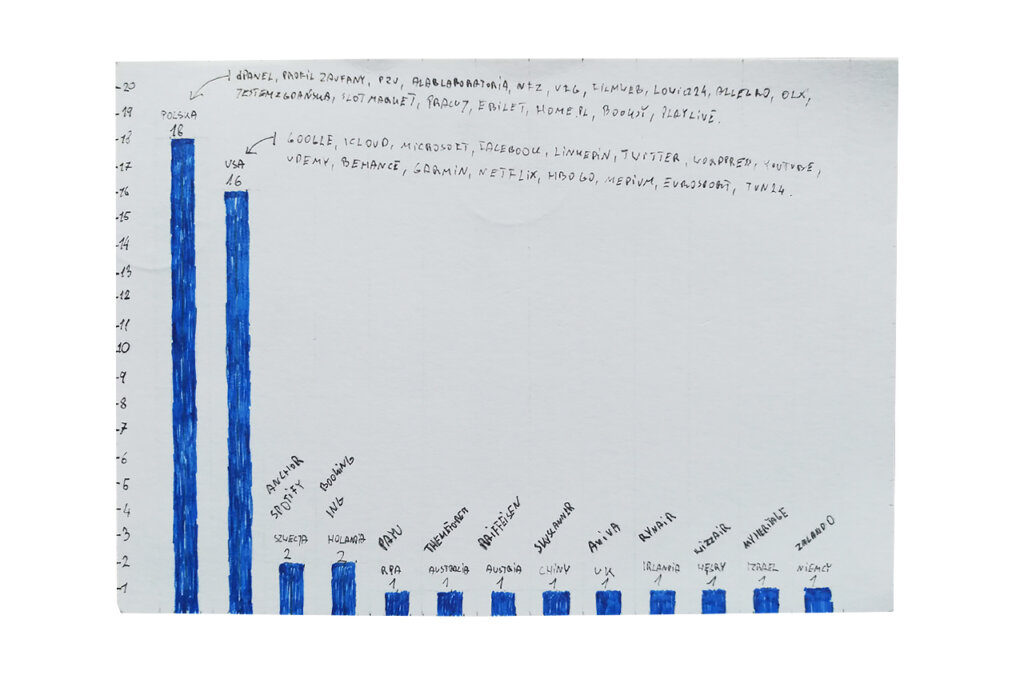
I decided to check the location of companies that administer my data in various services. Two countries dominate: Poland and the USA.

Klaudia’s postcard:

Klaudia approached the subject of privacy differently. This is why this project is so interesting. Klaudia’s card is enigmatic and this is great – after all, the content concerns private matters.

The process:


Klaudia

Topic:
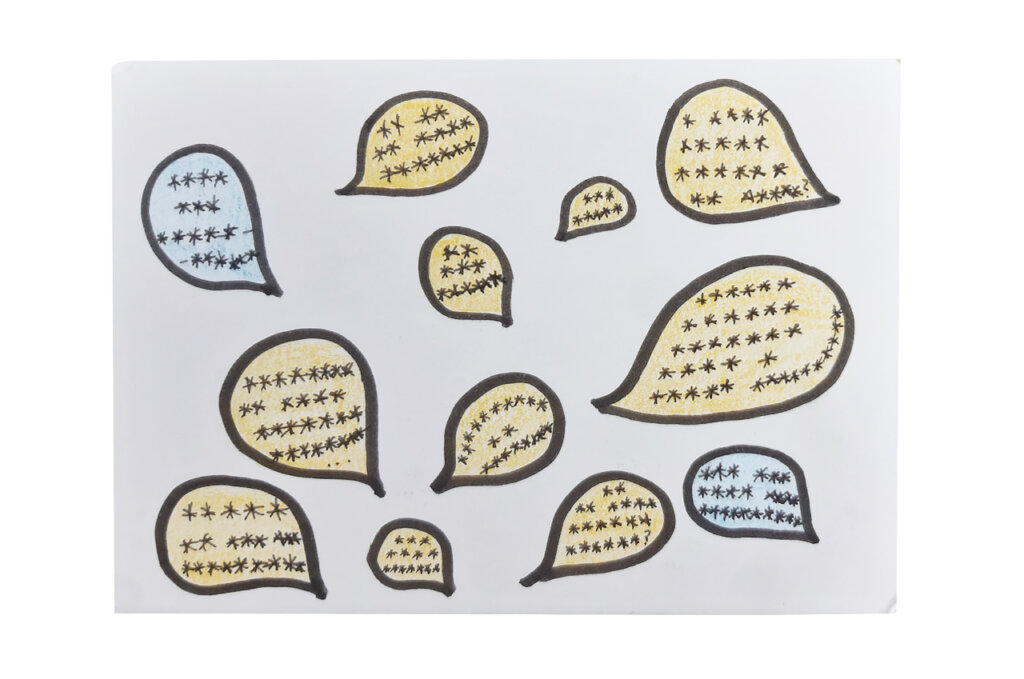
I was wondering how to approach this week. I associate privacy with time spent by myself, but we have already covered this in week 30 🙂 I decided to look at my feelings, thoughts, beliefs, reactions. How many words have I spoken and how many have I kept to myself? How many thoughts were so private that I wouldn’t want to share them with anyone else?

Data gathering:
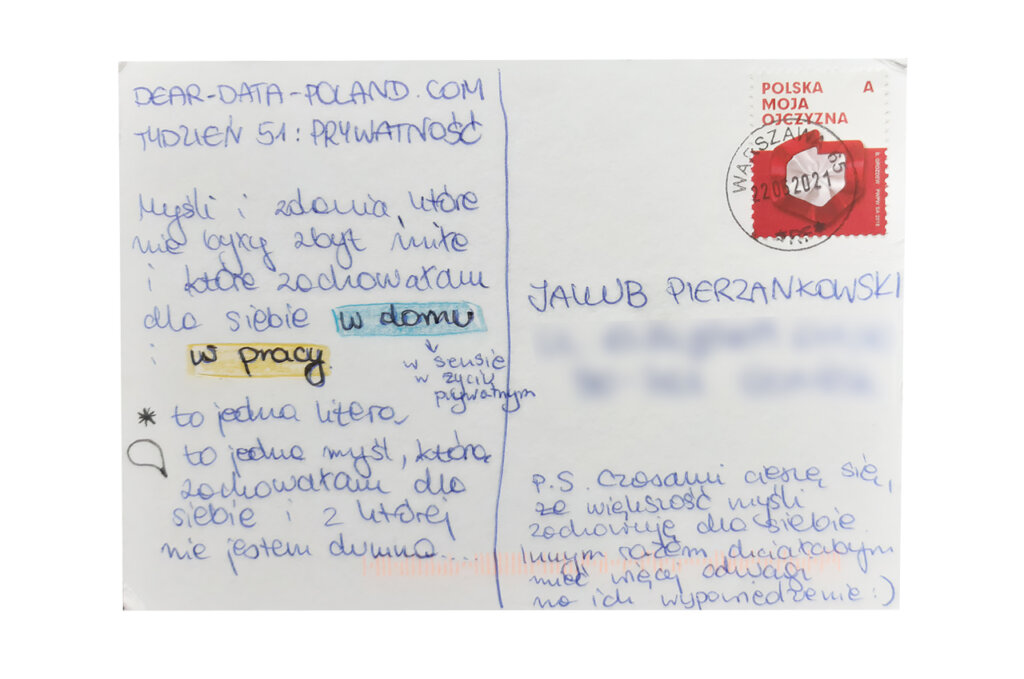
On a regular basis I wrote down the unspoken thoughts and reactions that came to my mind in response to someone else’s behavior. I suspect I have unknowingly omitted some data that I forgot to put on paper.

Data drawing:
I thought about the concept for a long time. I didn’t want to reveal too much. After all, I did not say these words on purpose. That’s why I used speech bubbles and encrypted secret sentences.

Jakub’s postcard:

I really liked Jakub’s approach to the subject. Internet privacy did not come to my mind. Gathering information on the headquarters of companies that administer personal data is an original and creative idea.

The process:
Categories
Uncategorized

Week 50

Jakub

Topic:
A few years ago, the “Screen Time” function appeared in iOS. Its purpose was to make users aware of how much time they spend looking at the screen and that they should limit it.

Data gathering:
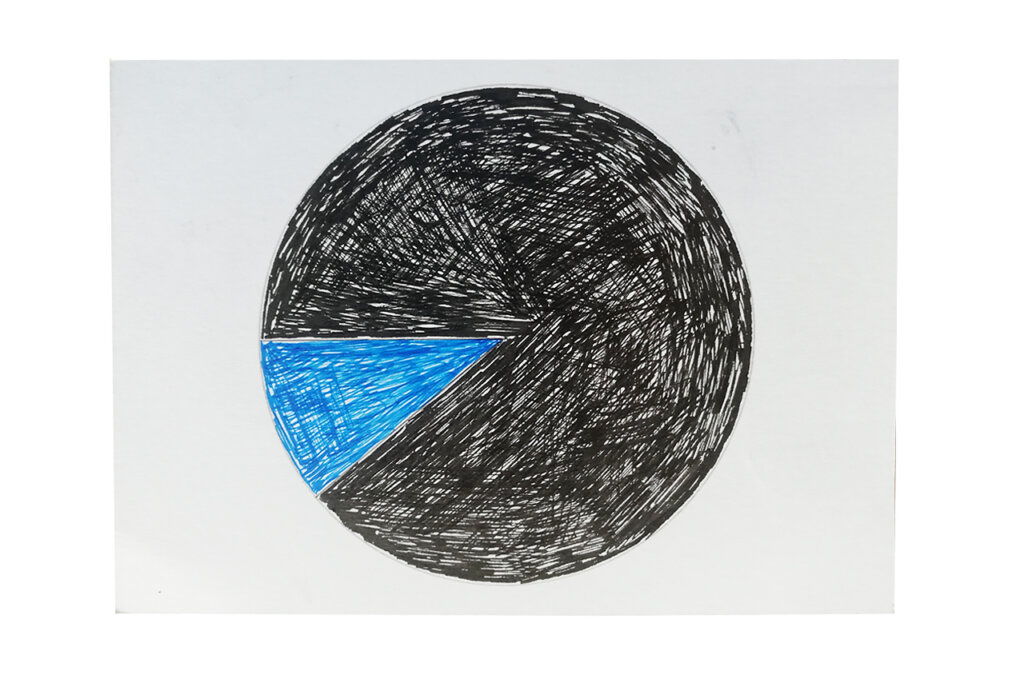
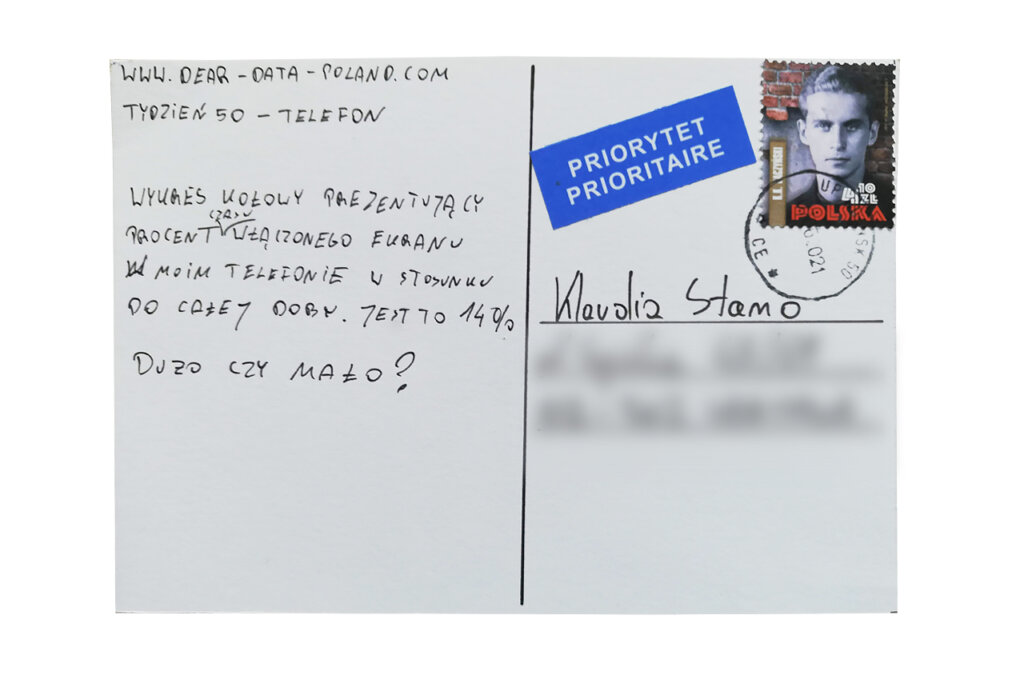
I used this “Screen Time” function to check how long during the day my phone is awake. The result of 14% on average is satisfactory for me. For sure there are many people around who spend twice as much time using their phones.

Data drawing:
A simple pie chart. Finish of the project = simple visualizations 😉 I like the inaccurate circle filling.

Klaudia’s postcard:

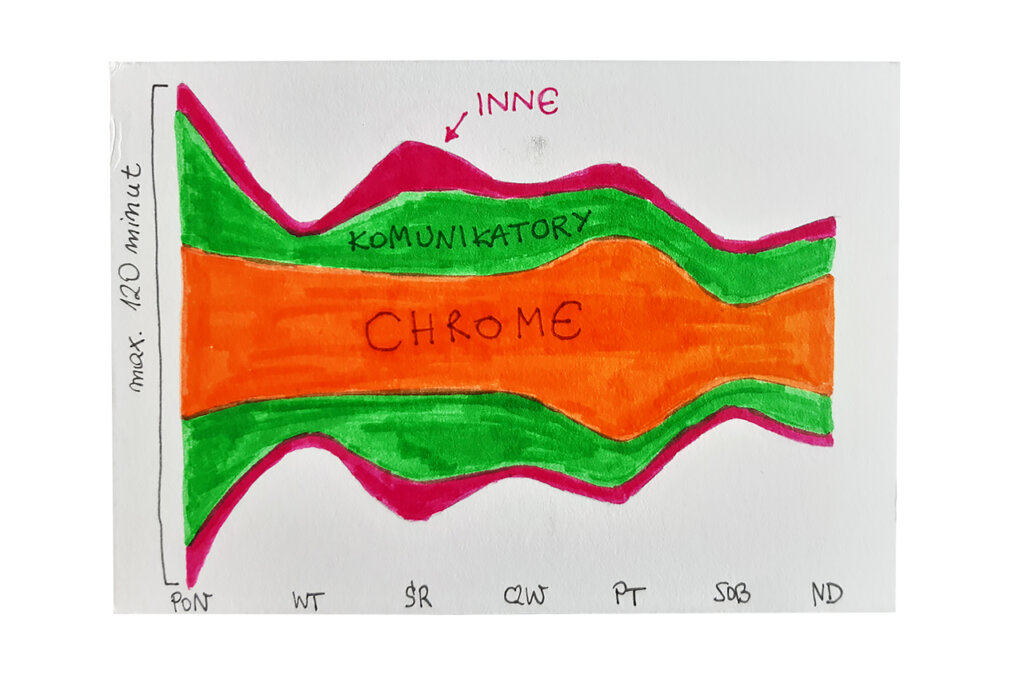
The mirror image makes it difficult to interpret the graph. In the 21st century, we use the phone more often to look for information than to communicate with other people. Klaudia’s postcard reflects this.

The process:


Klaudia

Topic:
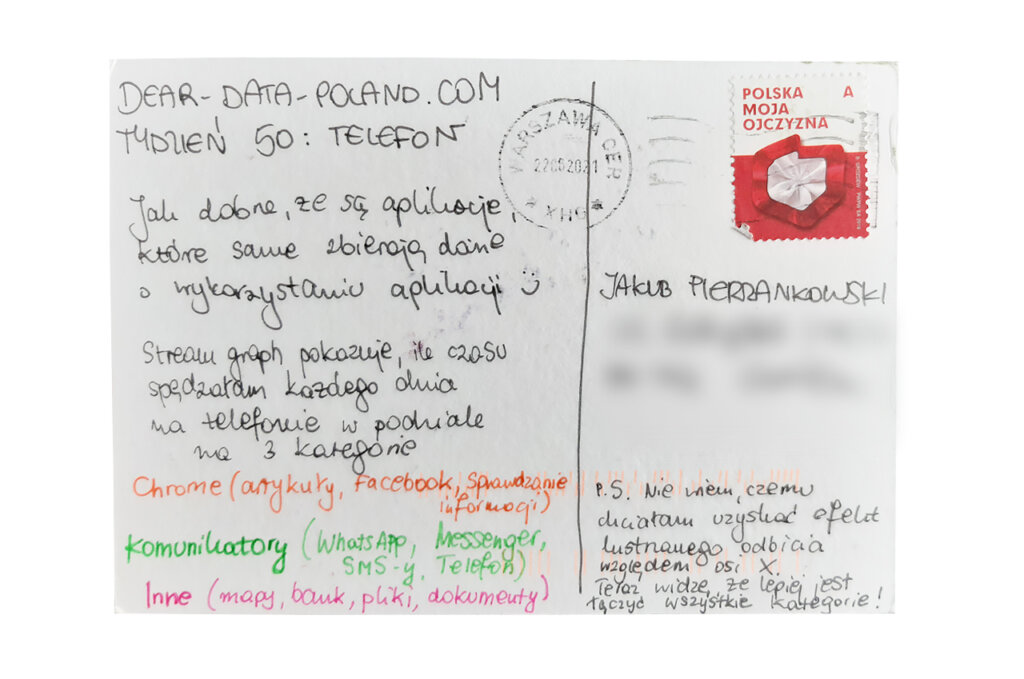
I only have a couple of interesting applications on my phone. I deliberately uninstalled all the others that were stealing too much of my time and energy. I use my phone mainly to search for information and communicate with friends. This week I wanted to check if my image of reality was not distorted.

My phone serves also as a source of podcasts and audiobooks, but I don’t count that because I don’t look at the screen while listening.

Data gathering:
In my phone settings I can check how much time I spent in the previous 7 days using different applications. Thus, I did not have to worry about collecting data.

Data drawing:
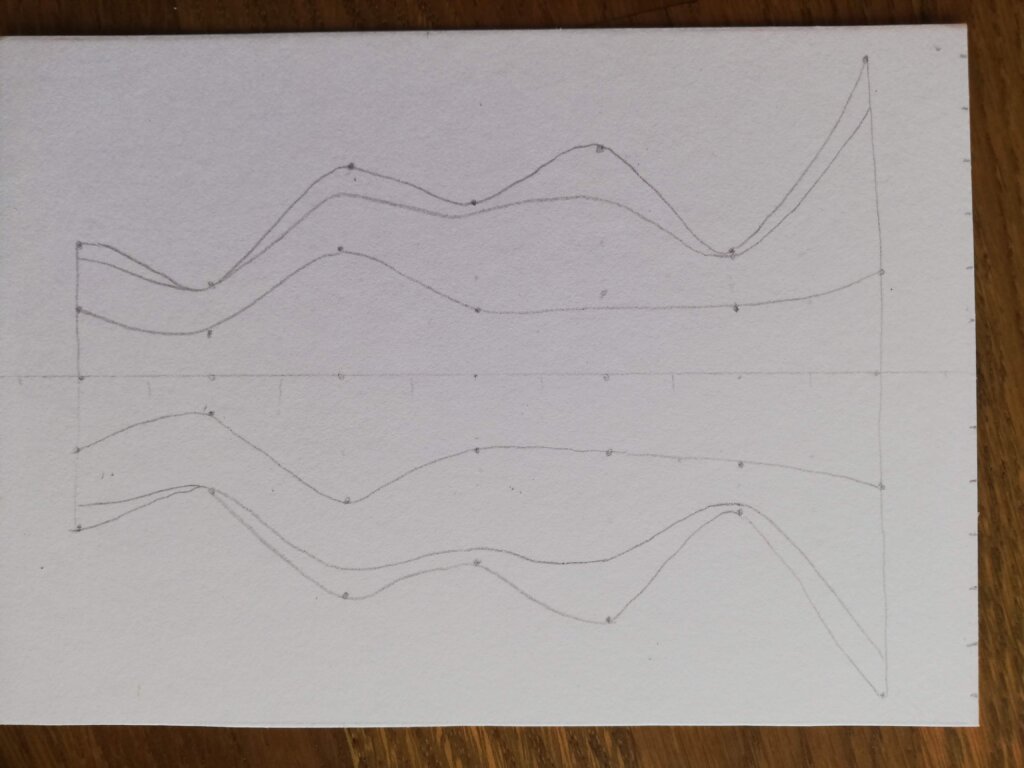
I’ve wanted to use a stream graph for some time. I think it fits this type of data, but I made one major mistake that I actually noticed only after finishing the postcard. I do not know why I made a mirror image. Luckily I treat Dear Data as part of my learning process so it’s OK to make mistakes.

Jakub’s postcard:

The postcard reminds me of Pacman;) 14% * 24h = over 3 hours of active phone. For me it is 1.5 hours, so half as much. But the truth is I spend a lot of time in front of my PC…

The process:
Categories
Uncategorized

Week 49

Jakub

Topic:
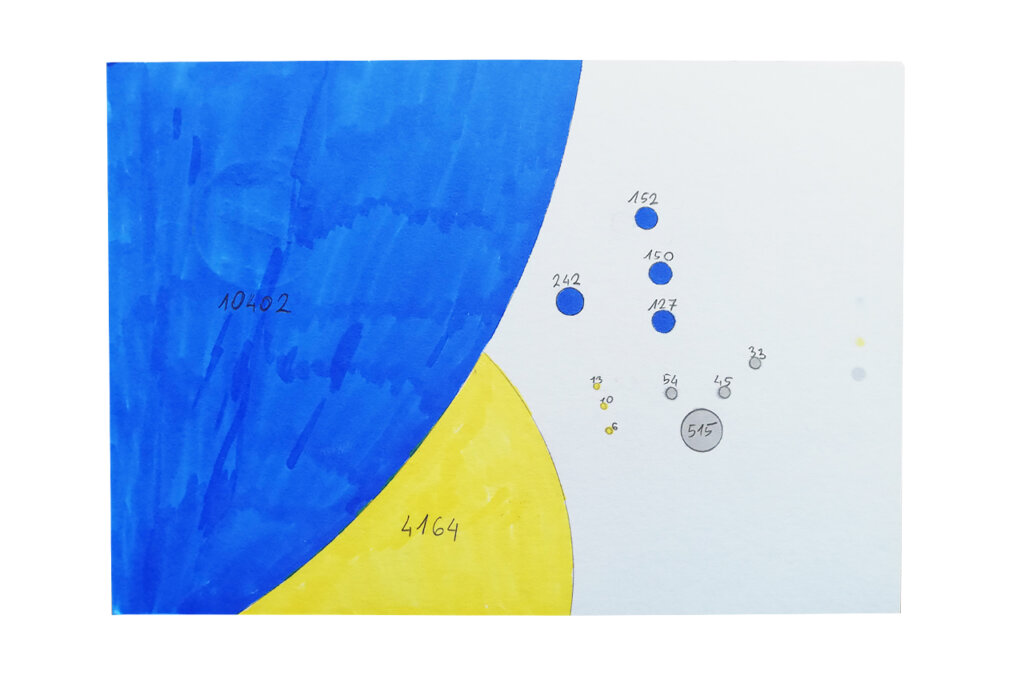
A book-size topic, it was difficult to decide what to focus on. Fortunately, this week I was inspired by a fairly big excel file that I was working on. I decided to write down all the spreadsheets I had contact with and their size.

Data gathering:
It was not difficult. I use spreadsheets both at work and at home. Most often it is Excel or Google Sheets. 

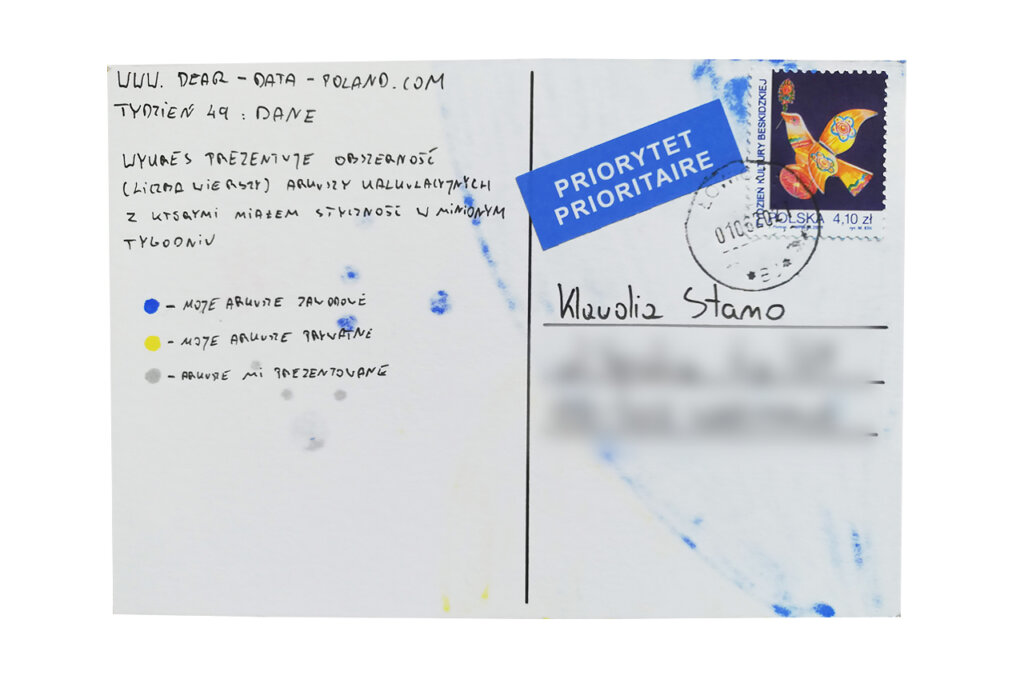
I was writing down the details of various spreadsheets on an ongoing basis: the number of rows and whether they were my private, professional or shared sheets. I was wondering what the average complexity of these sheets would be. My observations showed that most often they were simple files. Except for the biggest one that inspired me in the first place.

Data drawing:
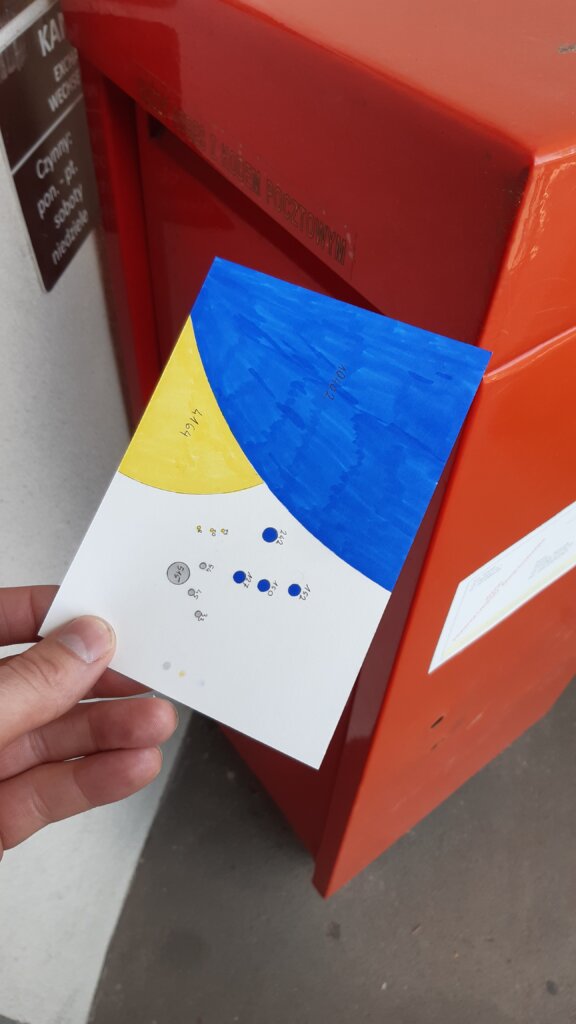
I couldn’t resist using my favorite technique: presenting data with circles. I think the chart shows well what I planned to convey.

Klaudia’s postcard:

A very interesting idea. It encouraged me to check how many pages I visit on average (a similar number). I am glad that your weekends are calm and partially offline 🙂 I like the combination of graphs very much. I would only change the position of the weekday axis labels from right to left;)

The process:


Klaudia

Topic:
This week‘s topic was so broad that I was tempted to quantify every aspect of my life. I was trying to write down every number that showed up in my daily activities, e.g. the number of calories in a yogurt. However, I felt overwhelmed after only a few hours.

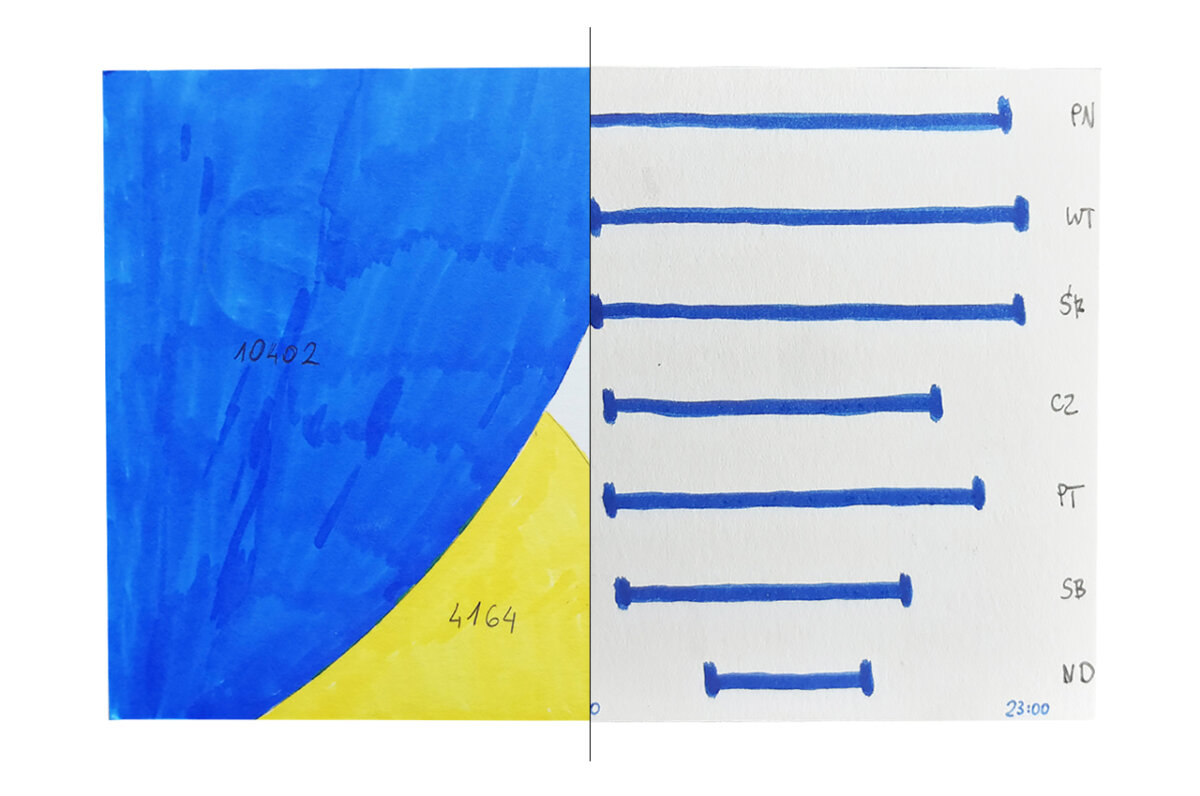
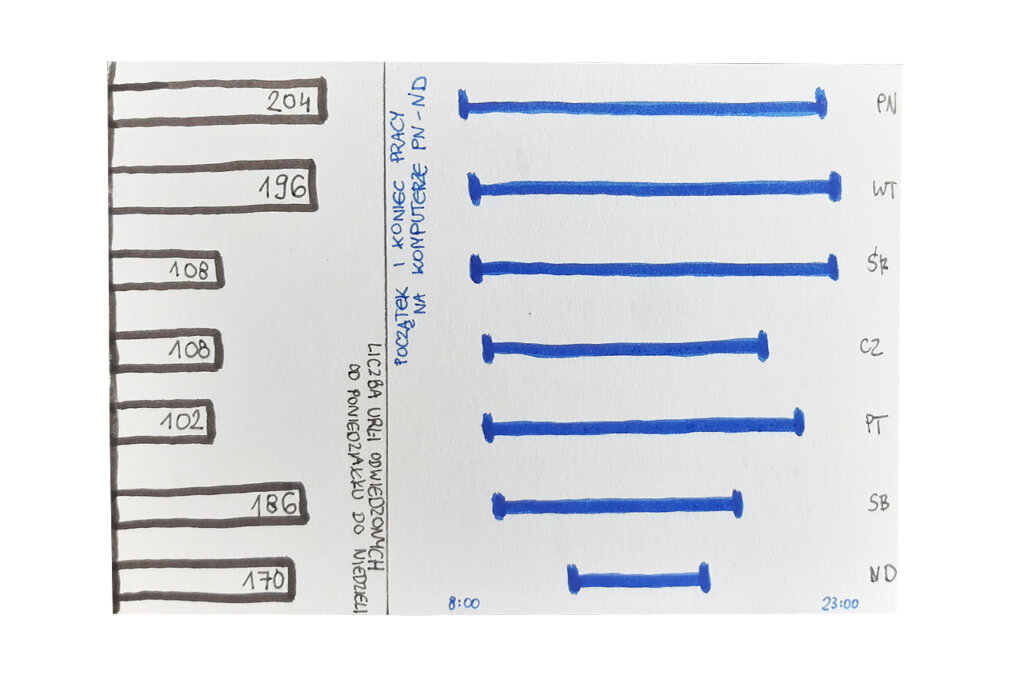
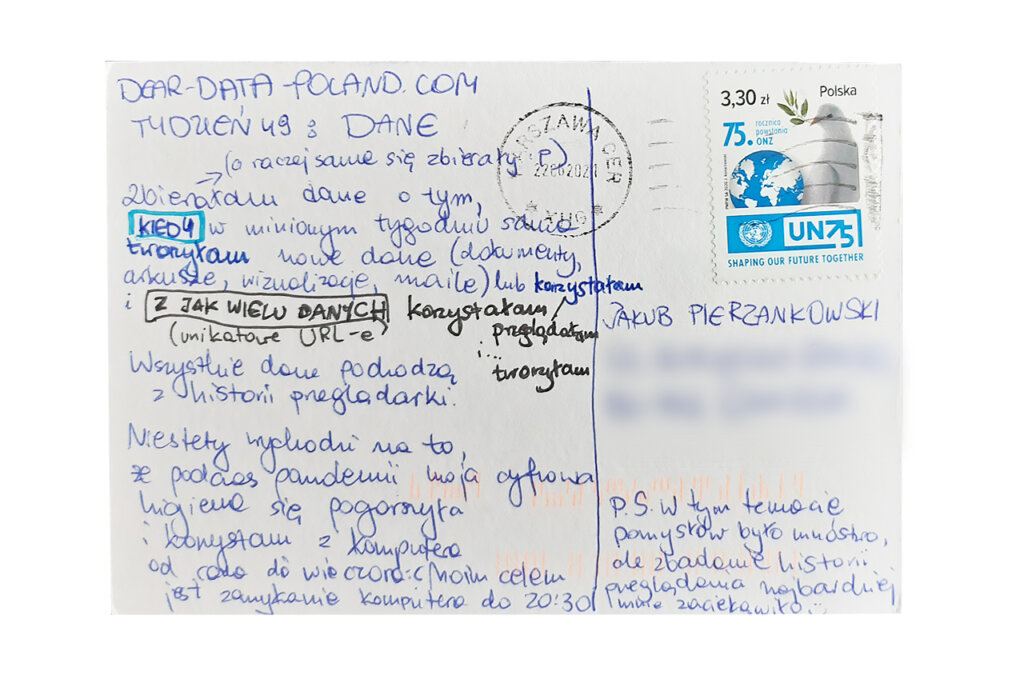
Thus, I focused on my digital footprint. How much data do I create? From how many sources do I get data? It came as no surprise to me that the number of pages, documents and sheets that I use every day reaches several hundreds. 

Unfortunately during the pandemic I neglected my digital hygiene and, as you can see on the postcard, my computer was in use from morning till evening.

Data gathering:
At the end of the week, I exported usage data from a web browser. It shows all my activity, because I use almost exclusively online programs, both at work and in private projects.

Data drawing:
I really like “duration charts” (at least I call them this way). I used them to show when I was online last week, and probably working.

The bar chart shows how many data sources I have used or created. I was surprised that there is so much of it!

All in all, nothing special has come out of this postcard. Sometimes it happens… 🙂

Jakub’s postcard:

Another card resembling the Solar System 🙂 I like the use of circles and the clear proportions.

It is interesting that with such a general topic we decided to perform a similar analysis.

The process:
Categories
Uncategorized

Week 48

Jakub

Topic:
Probably most of us eavesdrop, usually involuntarily. On the bus or while standing in line. Sometimes we eavesdrop intentionally, e.g. when we want to find out who our partner is talking to on the phone and on what subject. I would like to point out that in my relationship, fortunately, there is no jealousy 😉

Data gathering:
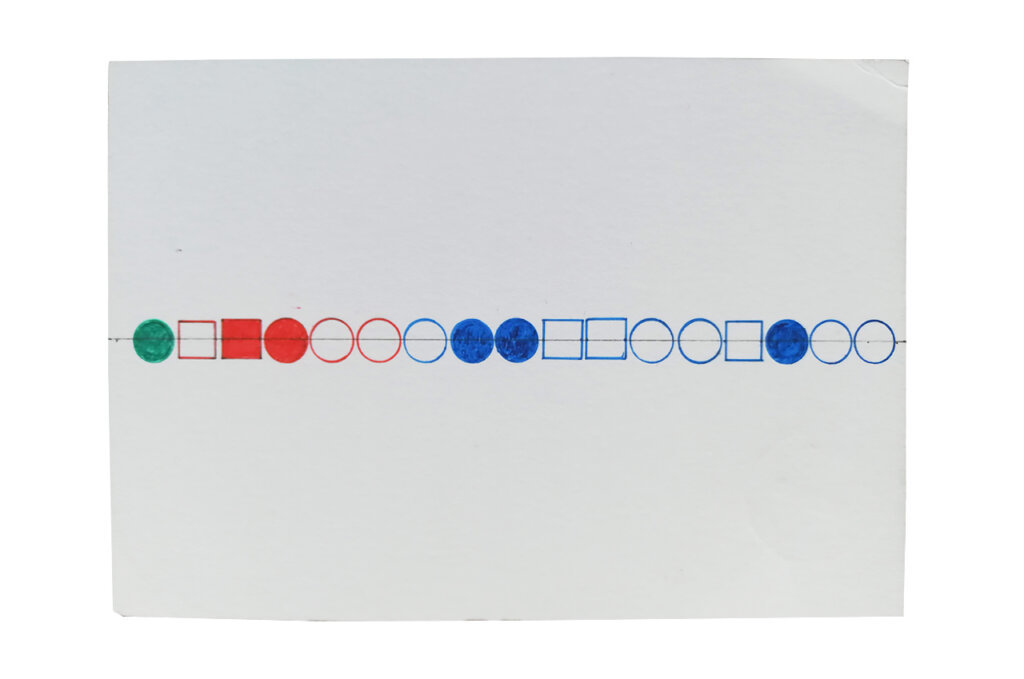
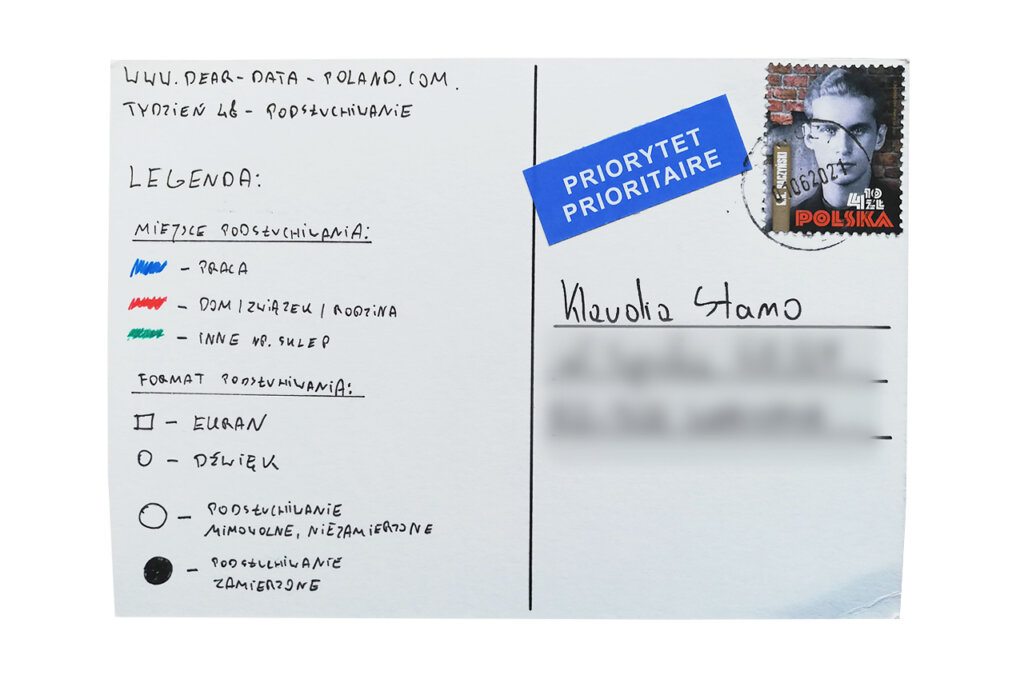
I collected data the classic way. I had a reminder on the phone every hour and I was writing down current “eavesdrops” along with a short description: place, format and whether they were intentional or accidental. I collected much less data than I thought, only 17 records. I suspected there would be many more.

Data drawing:
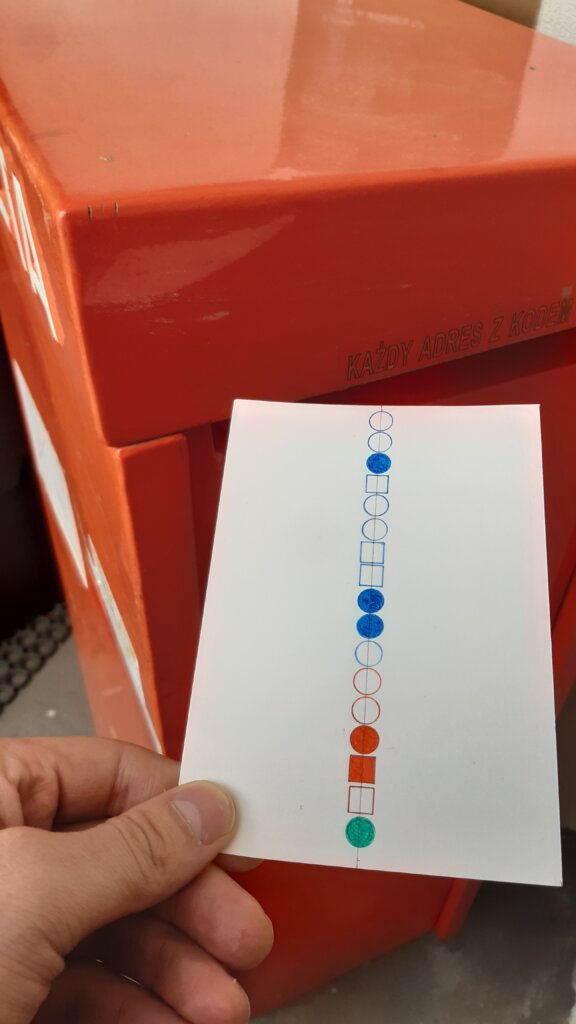
I focused on the chronology and emphasised the division into intentional and unintentional eavesdropping, which I considered the most valuable insight.

Klaudia’s postcard:

Klaudia approached the subject in a completely different way. Ah… this pandemic is sparking creativity. Valuable and interesting statistics, good advertising for the audiobook provider;)

The process:


Klaudia

Topic:
Highly interesting. How often do I eavesdrop, accidentally or deliberately? Unfortunately, due to the pandemic, I work from home and spend little time in public places. Data collected this week would not be representative of any other time in my life.

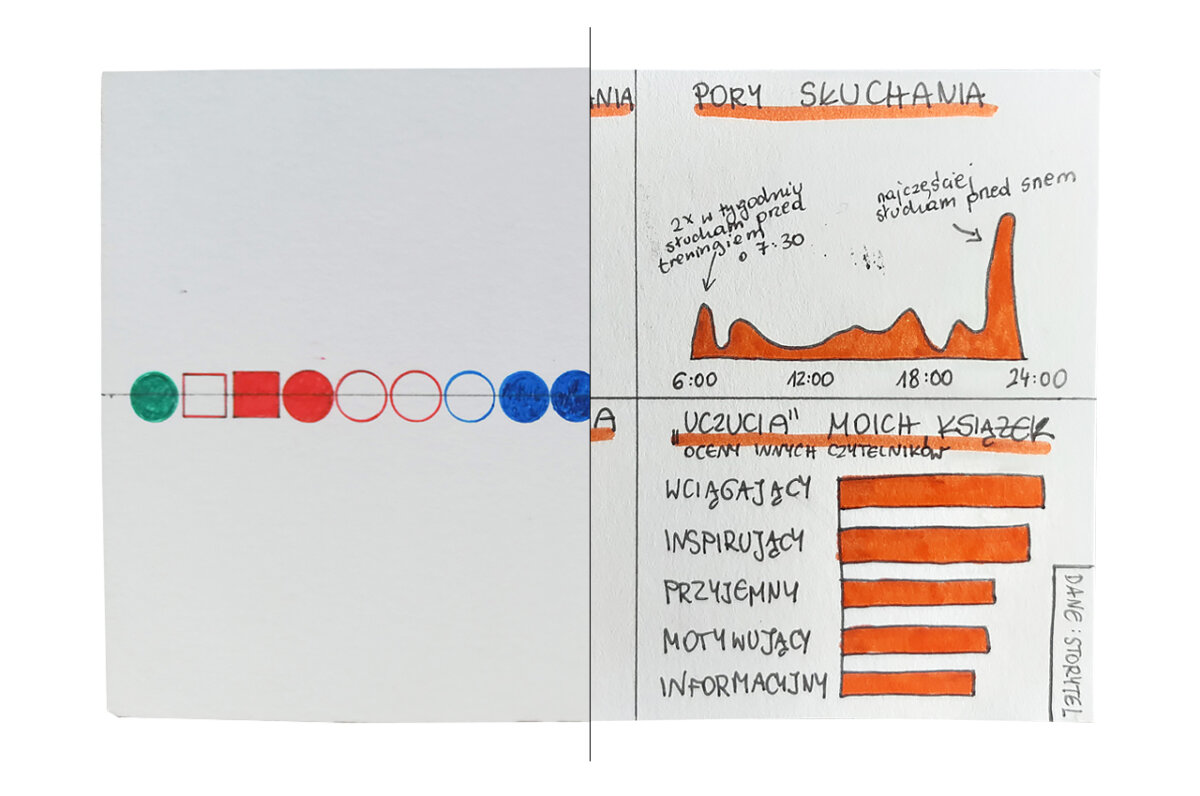
I started to wonder about alternative meanings of the word “eavesdropping”. Listening to audiobooks, which often accompanies me in the mornings and evenings, is also a form of eavesdropping on the lives of fictional characters. So this week I focused on audiobooks.

Data gathering:
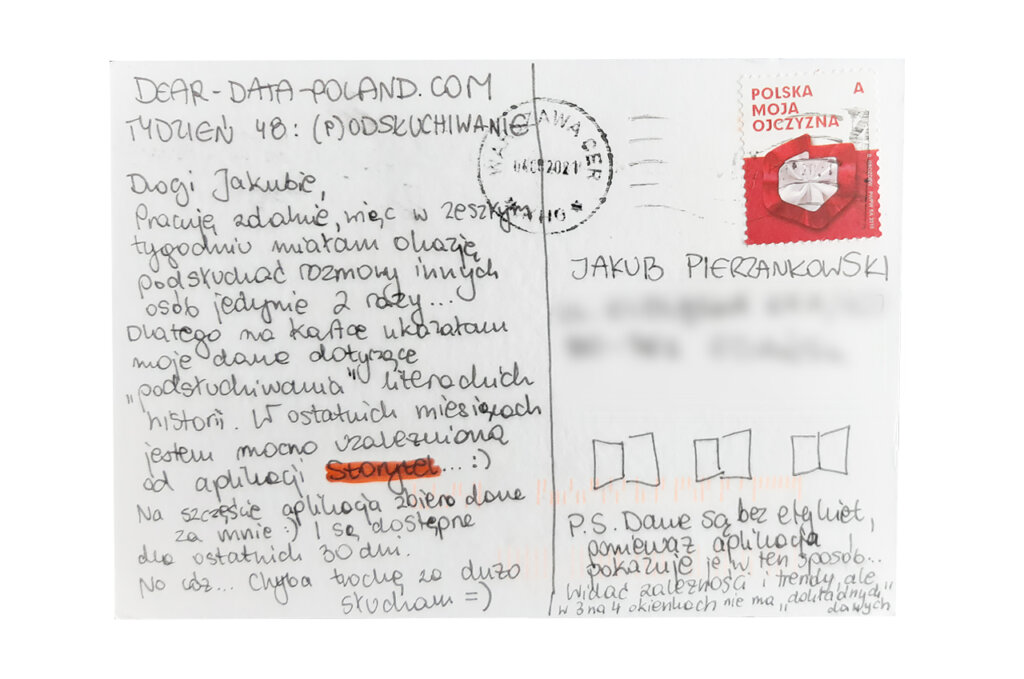
I made sure that the Storytel app, which I have been using a lot recently, makes available data from the previous week.

Data drawing:
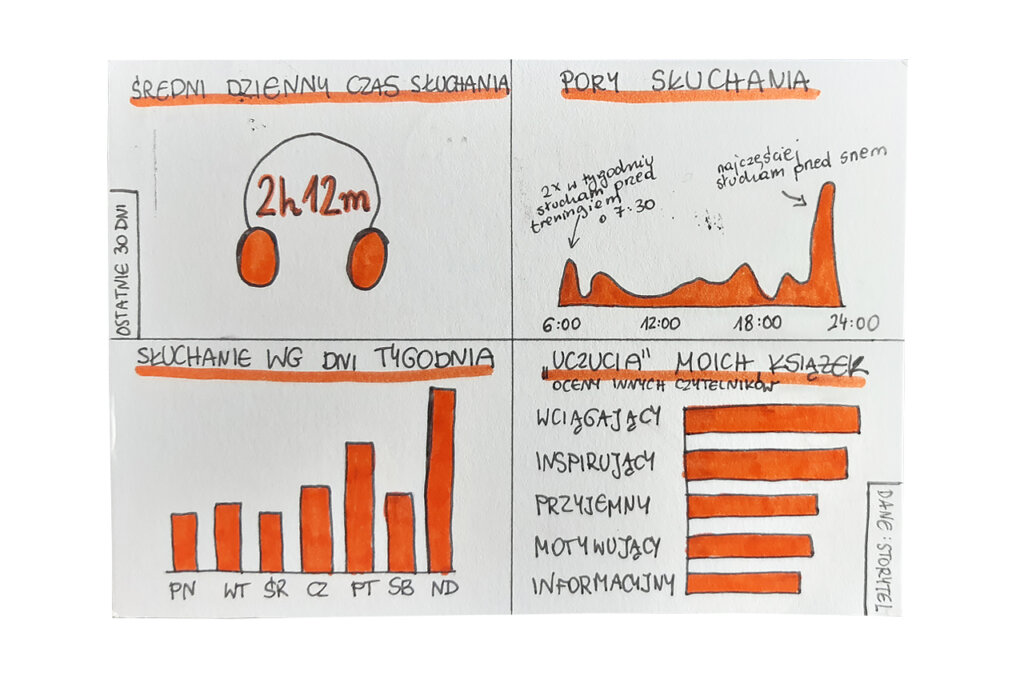
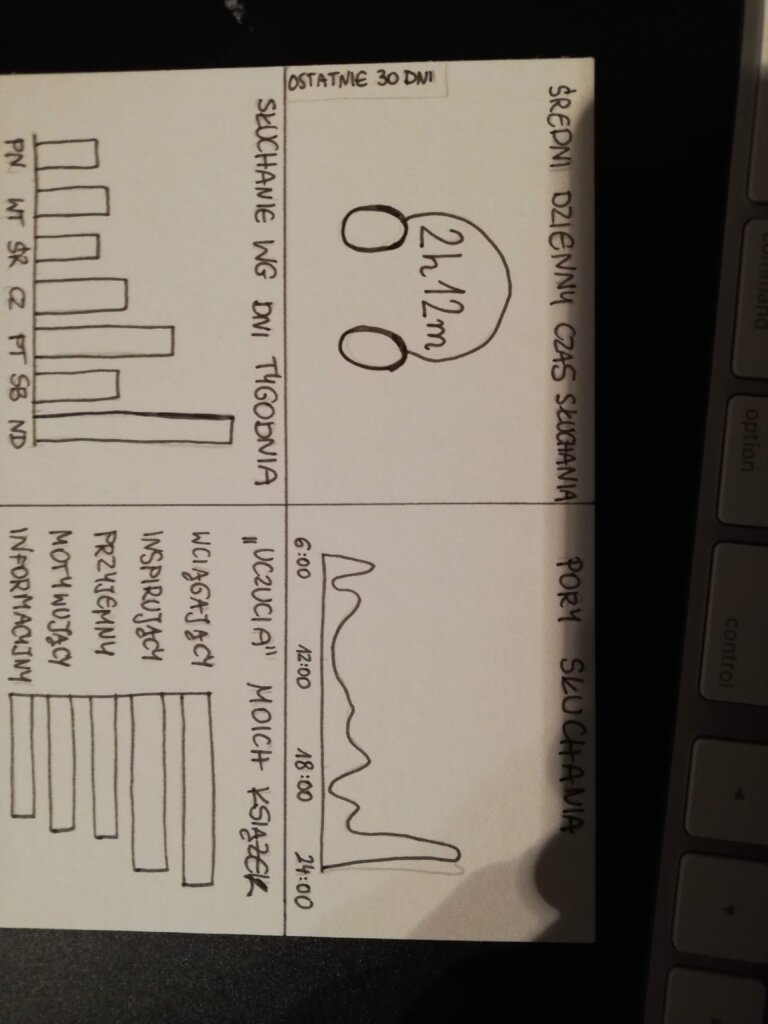
I really like to see data visualizations on the same topic shown side by side. This week I showed little creativity as I simply redrew the graphs from Storytel. However, that was the goal and I am pleased with the result. The only thing that surprised me was how much time I spend listening to books. To be honest I was listening to a very engaging story last week…

Jakub’s postcard:

It’s nice that Jakub managed to collect real data about eavesdropping. I suspect that if the Dear Data project took place in ordinary times, my “work” category would also be the biggest one.

The process:
Categories
Uncategorized

Week 47

Jakub

Topic:
I had absolutely no idea what to do this week. I was looking for a way to creatively avoid this topic. 

I came up with the idea to ​​buy perfume, which is always a special occasion for me.

Data gathering:
I only have one bottle of perfume at a time. I focus on quality, not quantity. I also never buy the same perfumes, because I like trying new scents. Buying a perfume is really special for me, as it is an expensive pleasure and I enjoy the mere process of choosing. I spend up to an hour at the drugstore and ask the salesperson a million questions. By eliminating, I reach 2-3 fragrances, and the final decision depends on the shape of the bottle. I treat perfume a bit like a sculpture on my shelf.

Data drawing:
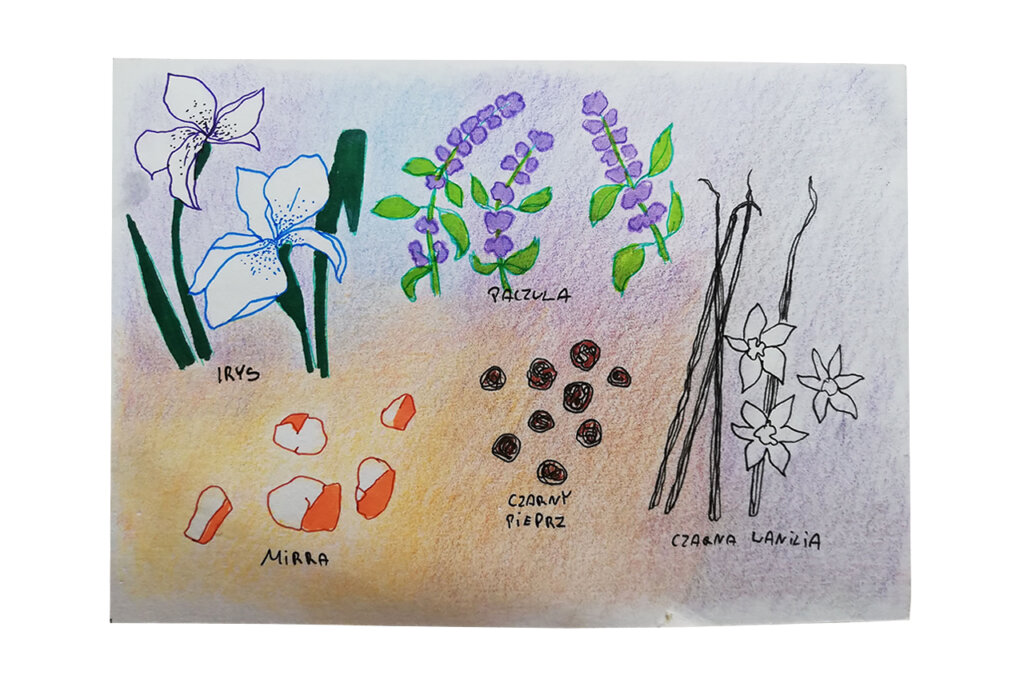
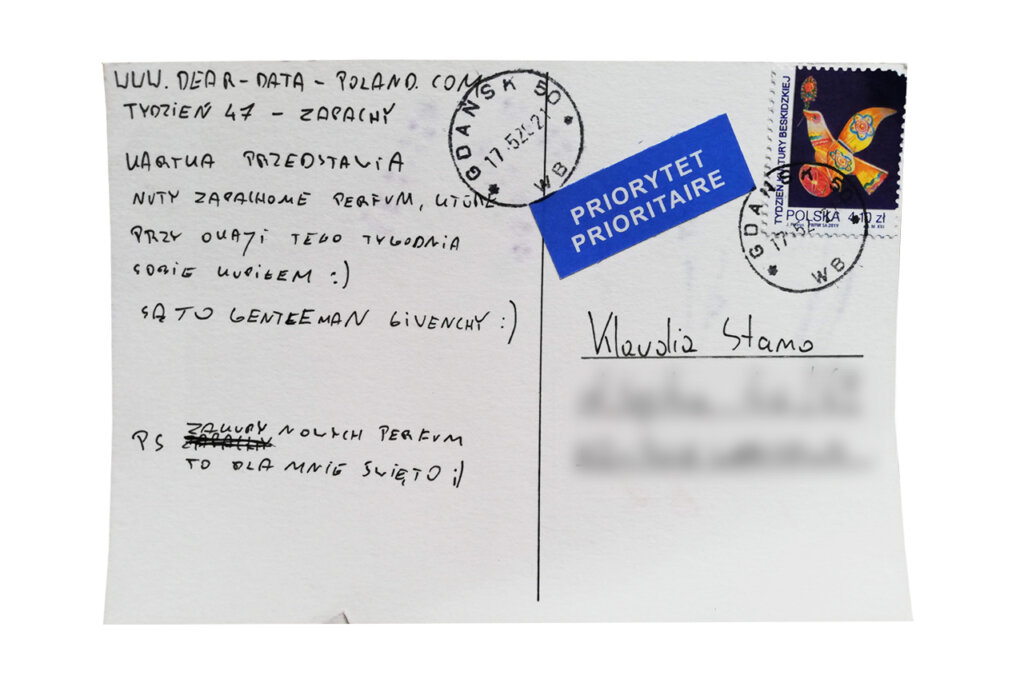
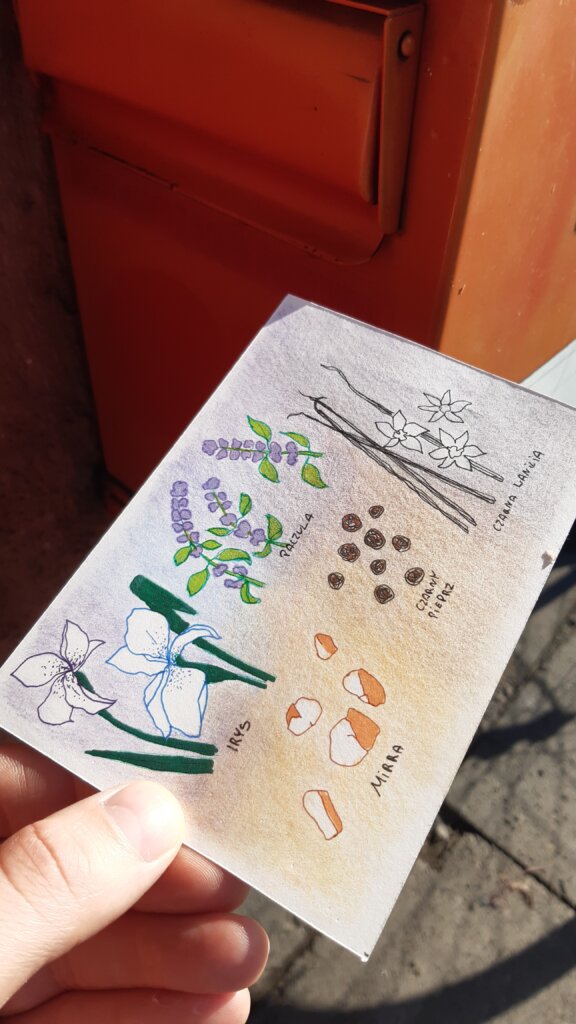
I admit that I took the easy way out. I analyzed the composition of the newly purchased perfume and with the help of my girlfriend I drew the ingredients.

Klaudia’s postcard:

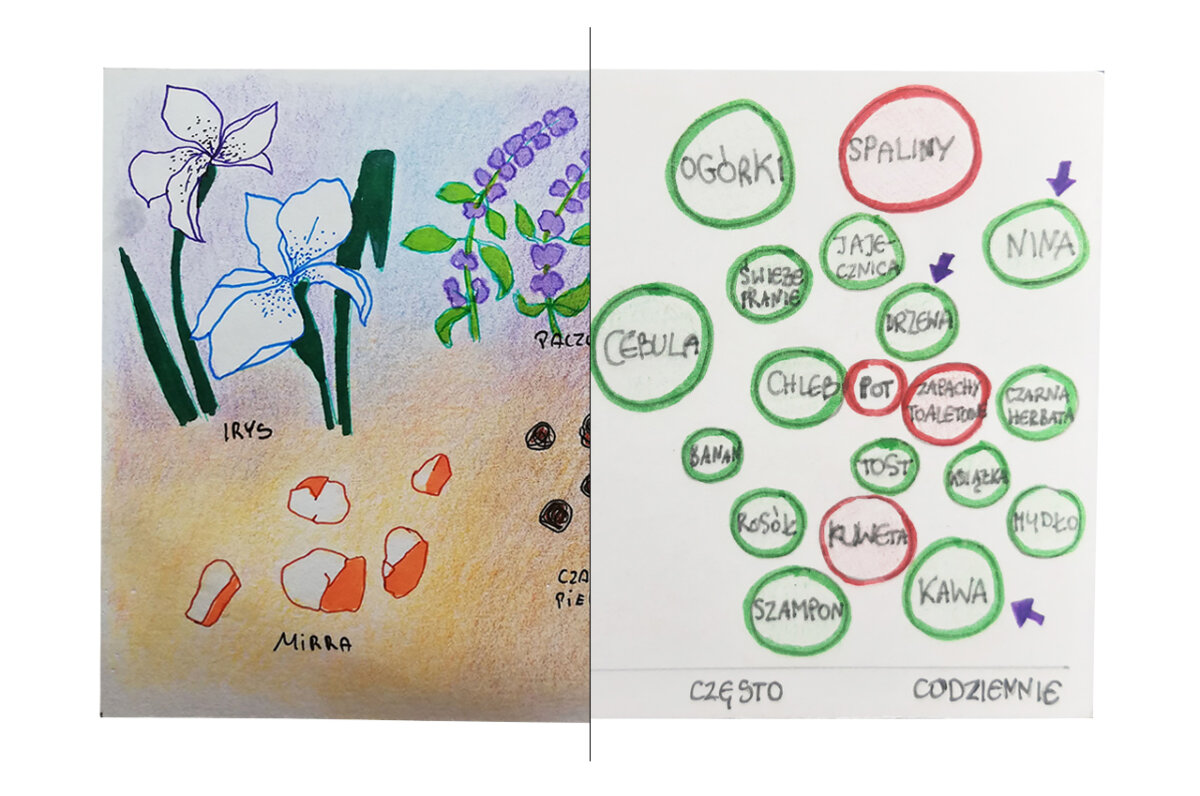
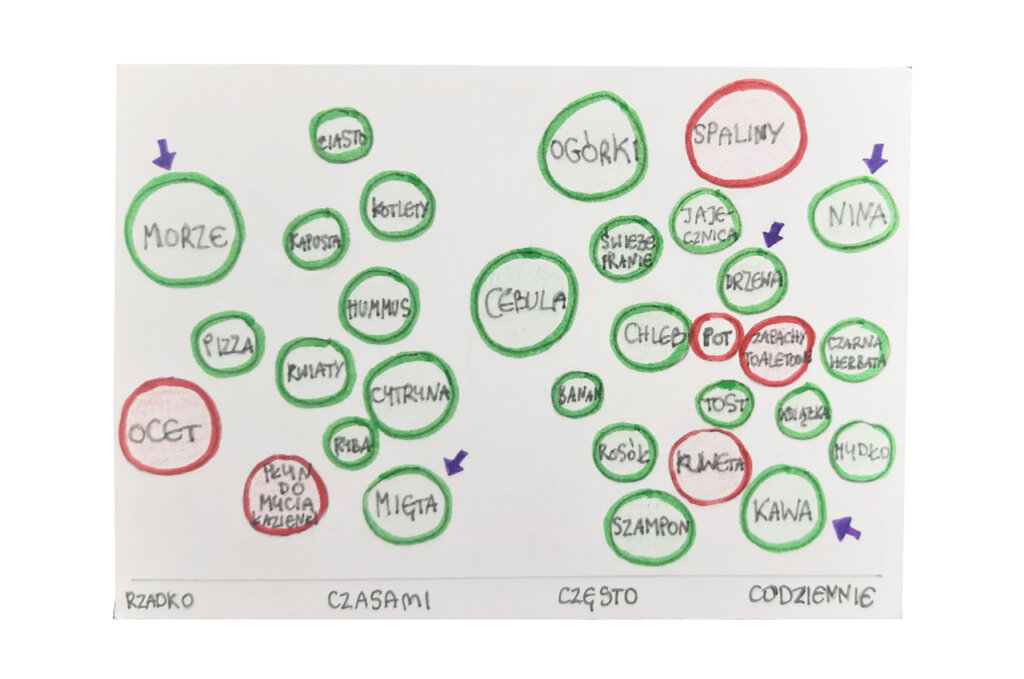
Klaudia did not take shortcuts. The data collection process must have been arduous. It’s good that the graph is dominated by pleasant smells… and the sea 🙂 I love circle-based data visualizations.

The process:


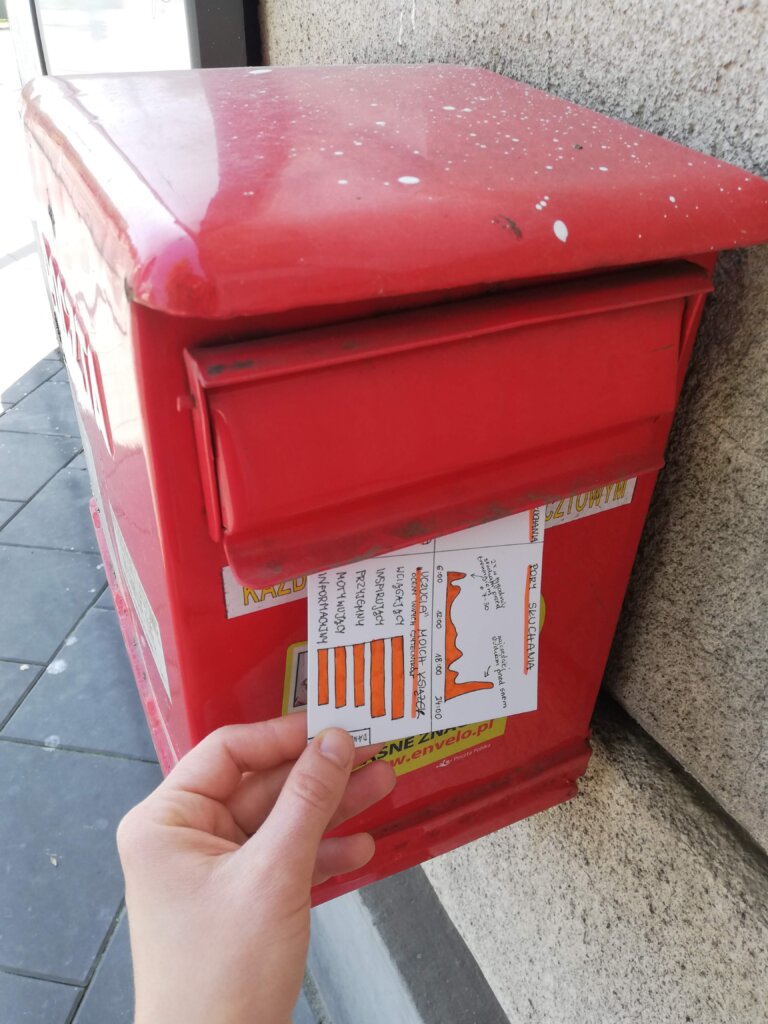
Klaudia

Topic:
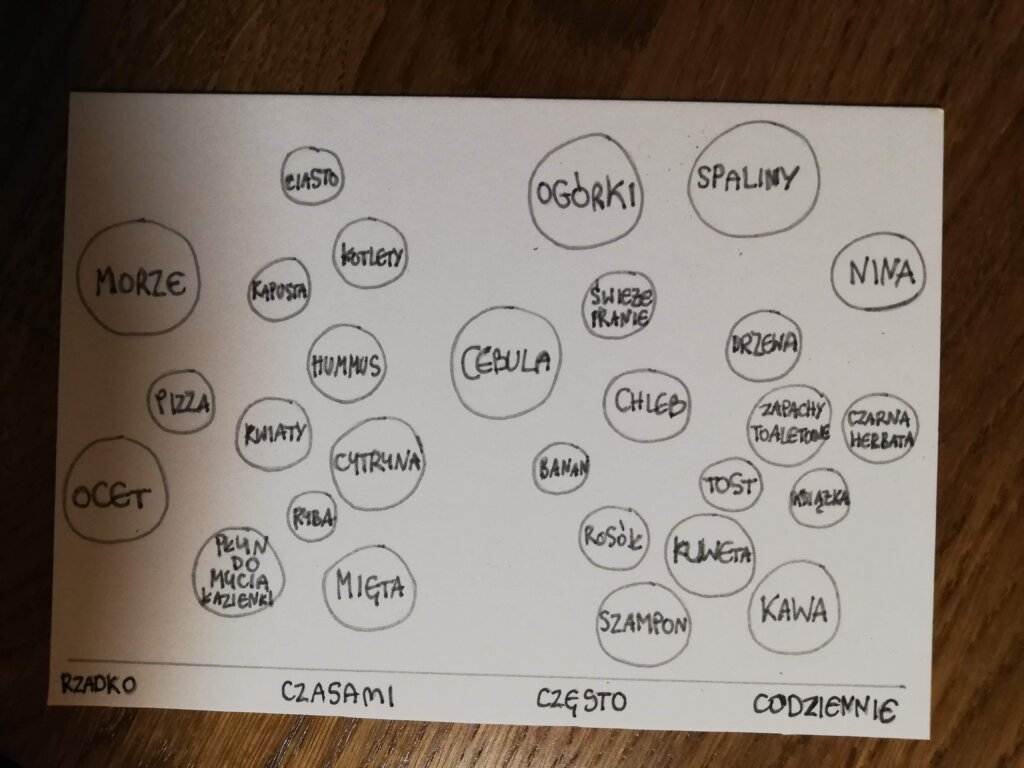
The subject is completely neutral to me, but I was curious to see how many scents I could detect in just one week.

Data gathering:
I focused on everyday fragrances. I noted them down during the day or in the evening.

Data drawing:
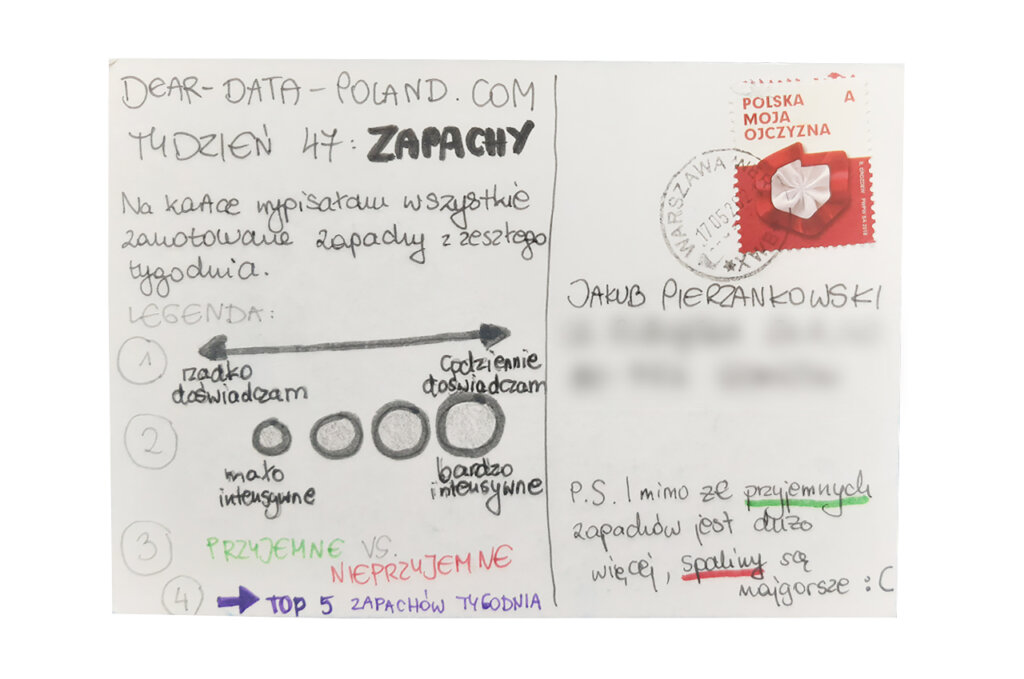
As usual, I started with the analysis of the collected data. I was wondering what they say about me and how I can break them down into categories. I was interested in the proportion of pleasant to unpleasant fragrances and how often certain fragrances appear in my life.

Although there were a lot of pleasant smells this week, I was really bothered by smog. Unfortunately this is my daily annoyance, as I live in the centre of Warsaw.

In turn, the sea, which I visited just for the weekend, gave me the most pleasant experience.

Jakub’s postcard:

Amidst so many graphs it was refreshing to see a nice drawing, without any chart. 

Thanks to the postcard I found out what patchouli is and what it looks like. Thank you 😉

The process:
Categories
Uncategorized

Week 46

Jakub

Topic:
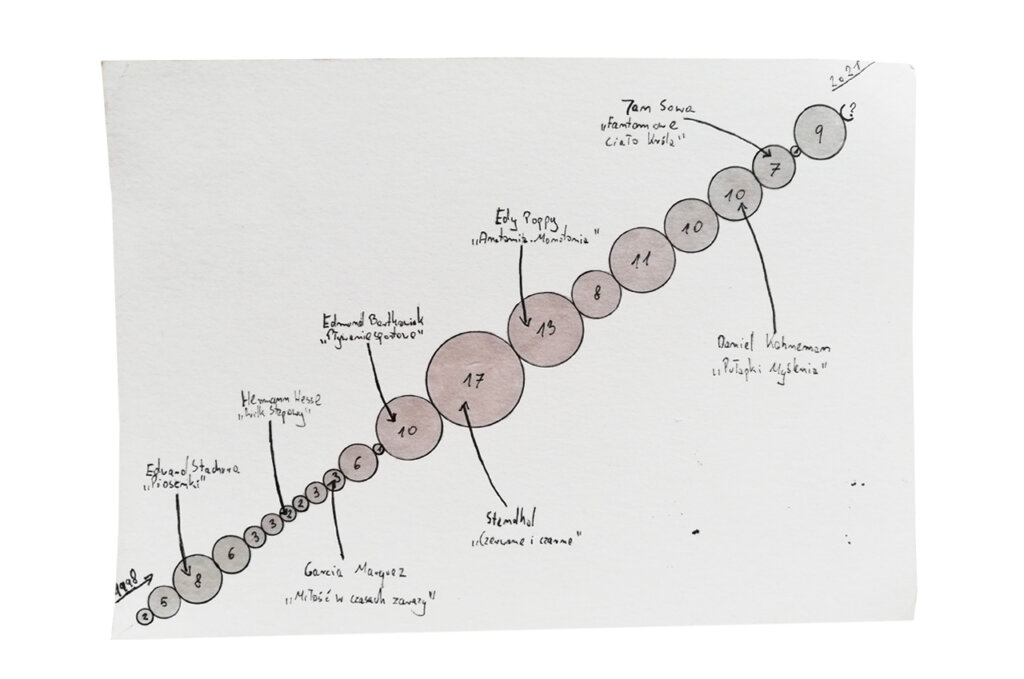
I read a few books a year, usually within 2-3 months, and then the enthusiasm wears off. This topic was a good opportunity to dig deeper into my reading preferences, especially since I regularly collect data about books.

Data gathering:
I have been running an online journal for the past 12 years, where I write down every book I read. To this list I also added books that I have read since 1998, when I was only 11 years old.

Data drawing:
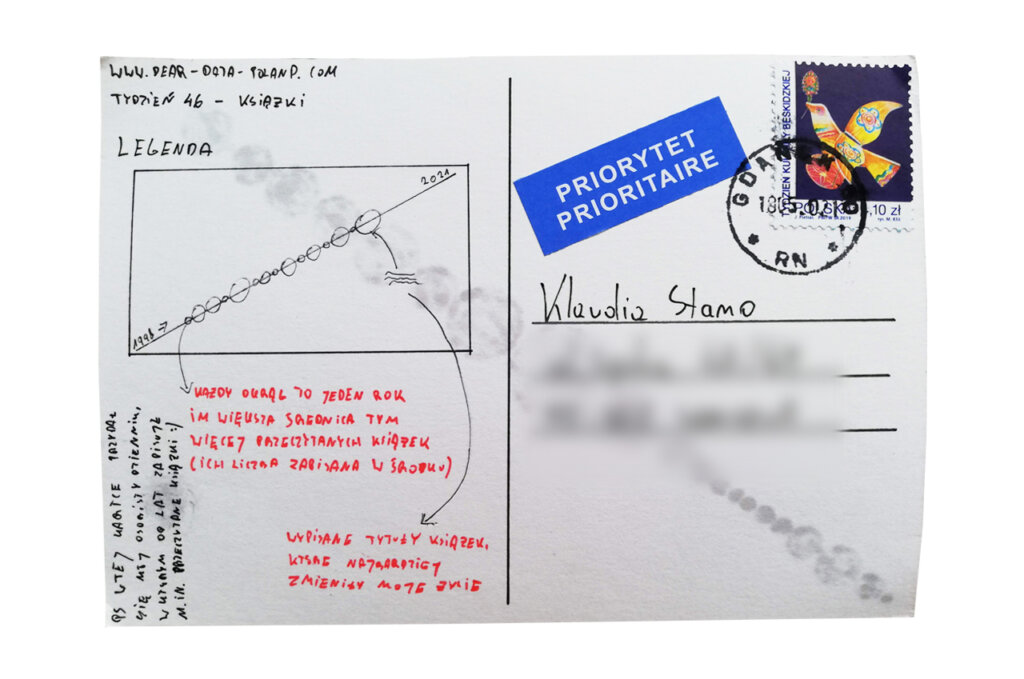
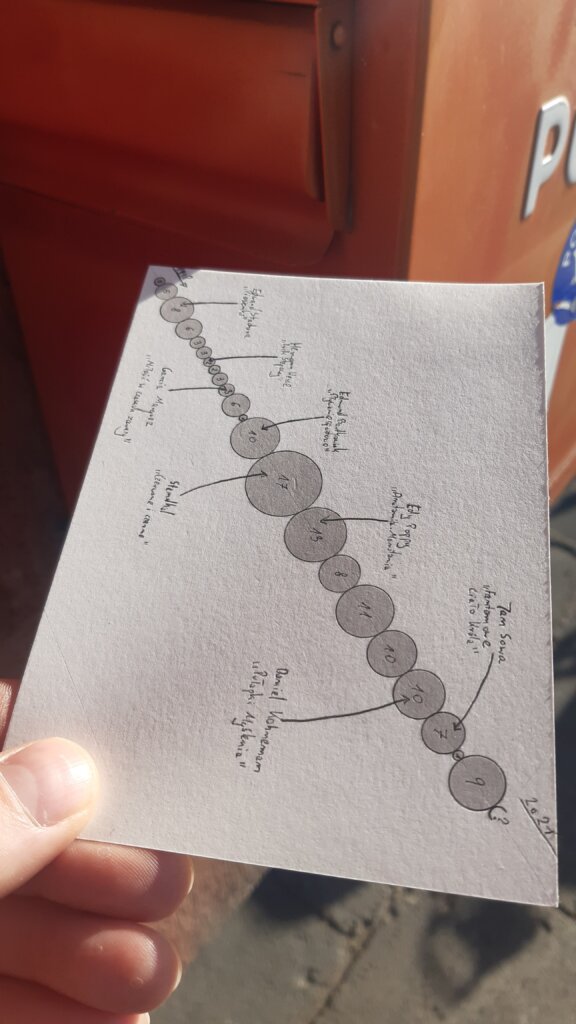
In the bubble chart I presented in chronological order the yearly number of books I had read from 1998 to today. I have also marked the book titles that influenced me most.

Klaudia’s postcard:

I have always dreamed of a large library and I am sure there will be one in my future home, even though I am a minimalist. I think that Klaudia’s 313 books can be considered an extensive collection. I am a bit jealous and I am sure that most of the books have been read. I like this postcard very much.

The process:


Klaudia

Topic:
Books are one of my favorite topics in the world. I read a lot, even too much… It is only June  and I have already read about 30 books this year, mainly novels, non-fiction, personal growth books and a few detective stories. The result is probably so good because in 2021 I decided not to watch any series and watch films only when I am accompanied by someone else. As a result, paper books, ebooks and audiobooks are one of the few forms of entertainment for me. 

I greatly appreciate all the other worlds I visit thanks to literature.

Data gathering:
One of the places in my apartment that I like the most is the bookshelf. Books make the best interior design in my opinion. 

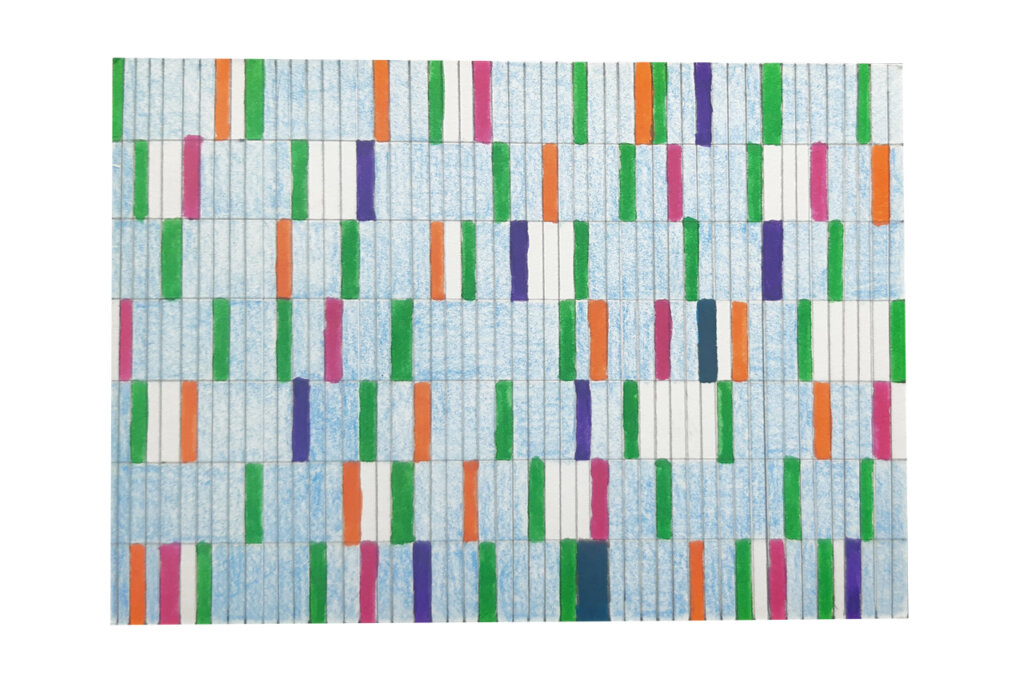
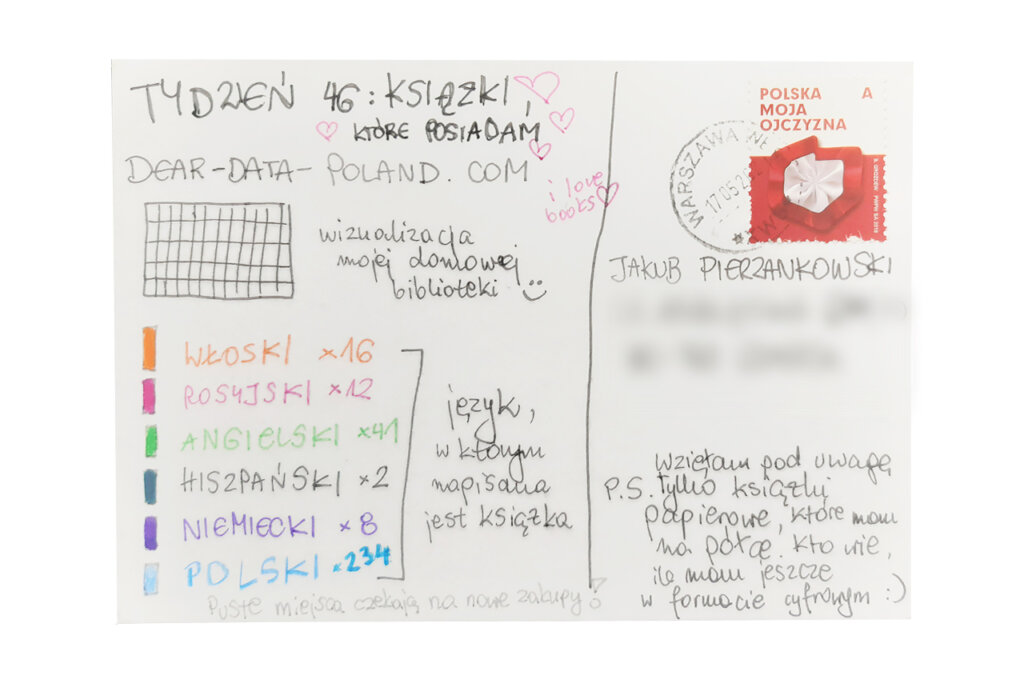
This week I decided to count my collection of books, broken down by language (did I mention that in my youth I had a passion for foreign languages?).

Unfortunately, for several years my “stationary” library has been expanding rather slowly, because nowadays I usually buy or rent ebooks and audiobooks.

Data drawing:
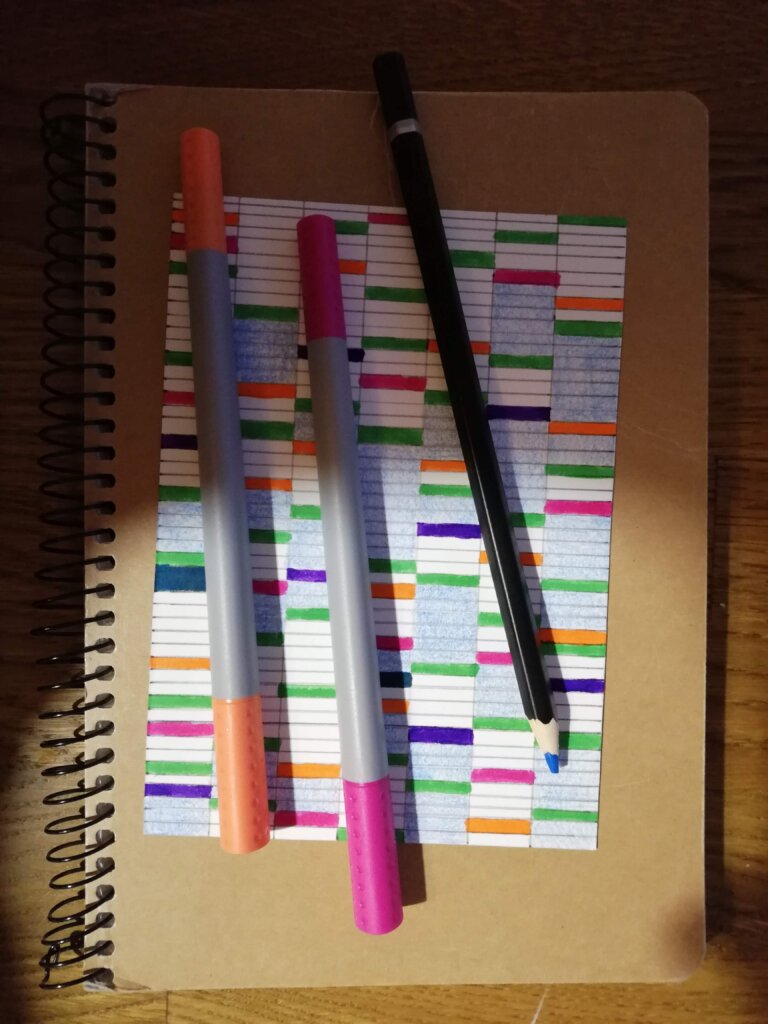
I aimed for a simple graphic that would resemble my library. I think it worked! The white places are still waiting to be filled with new books 🙂

Jakub’s postcard:

I am glad that I could get to know Jakub’s reading taste. I share a great deal of respect for Kahneman’s “Thinking Fast and Slow”.

The process:
Categories
Uncategorized

Week 45

Jakub

Topic:
I try not to disregard the meaning of words such as: I love you, I’m sorry, thank you, friend, I trust you, etc. I rarely say them and try to use them wisely. The word sorry, however, has its own characteristic and is often used in trivial situations. Such a trivial matter is, for example, asking someone to move if we cannot open a door or a refrigerator. Eight of the nine “I’m sorry” sentences I said this week were of this kind. I used the word sorry in a deeper sense only once this week.
Data gathering:
I kept the records in a notebook on my phone. It went smoothly. It’s my 45th postcard and I’m quite skilled at it. I was surprised by the fairly small number of “sorry” words addressed to me. I think I could have missed some of them.

Data drawing:
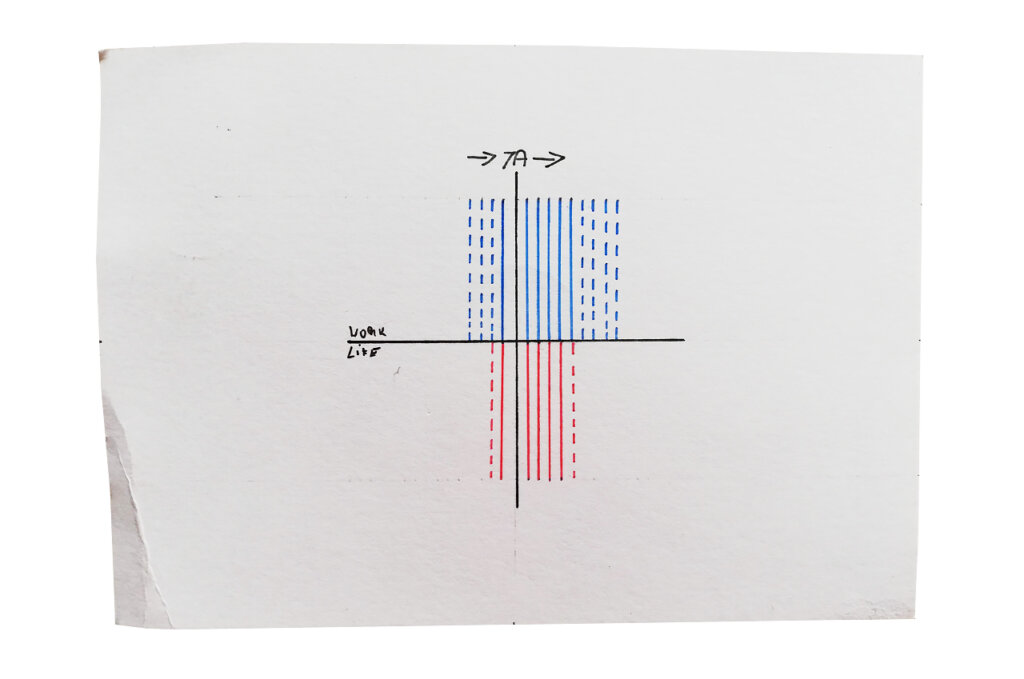
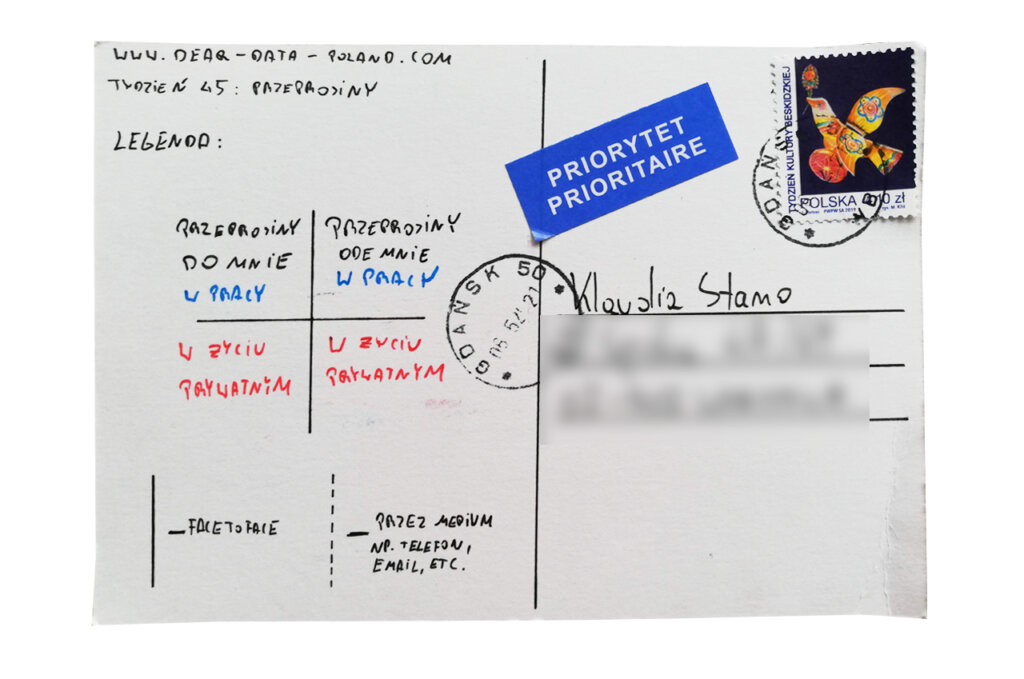
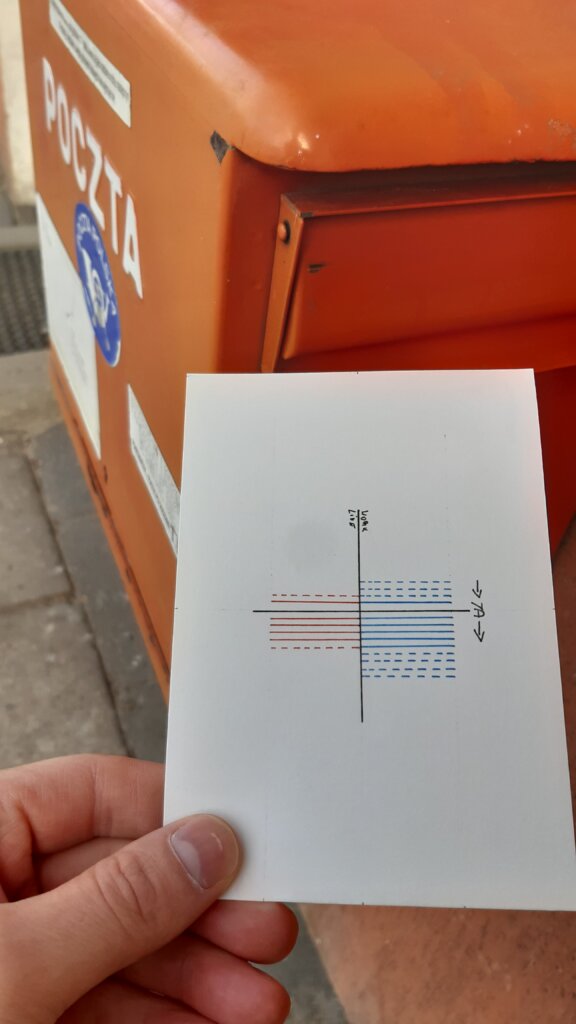
I had little time to draw my postcard and I was looking for a minimalistic creation. I decided to use the matrix and I think I overdid it. The combination of continuous and dashed lines impairs legibility. The same color of the axis labels is also a mistake.

Klaudia’s postcard:

The words sorry written in different languages disturb my reception of Klaudia’s postcard a bit. However, I know that it is difficult to draw a postcard with only a small amount of data. I also often choose to visually enrich my graphs. 

Klaudia… you were never late for our meeting 🙂

The process:


Klaudia

Topic:
I approached the topic without emotion. My philosophy is to have as few reasons to apologize as possible. Whenever I say something unpleasant, I try to fix the situation as soon as possible.

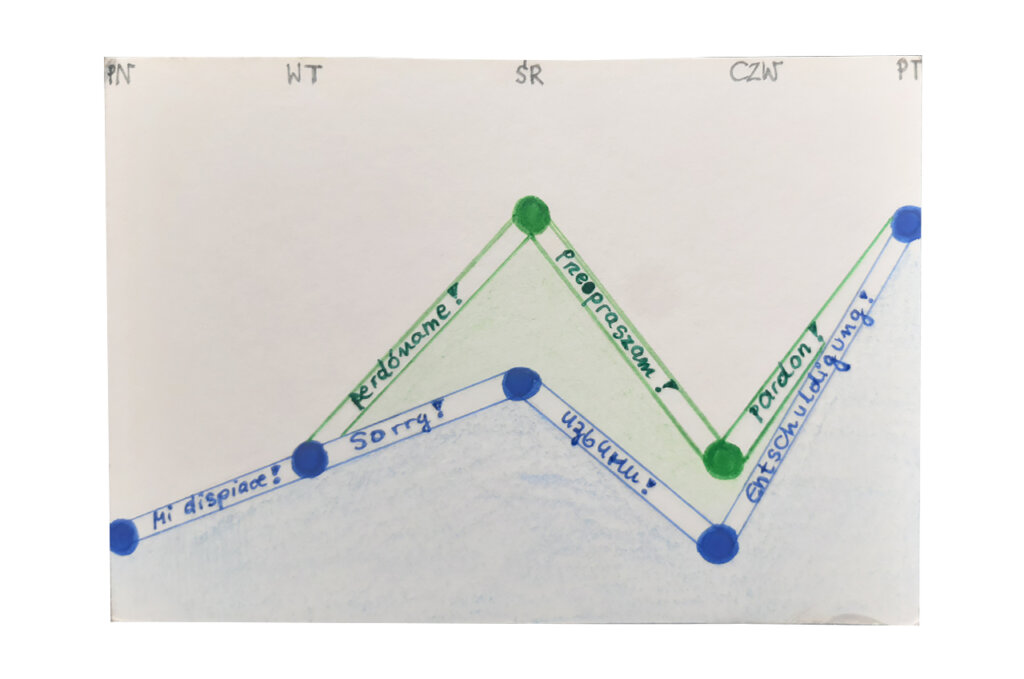
I am often late (especially for face-to-face meetings) and this is something I often apologize for…

Data gathering:
I did not collect much data. Due to remote work I probably avoided many small apologies that could have taken place in the office (e.g. taking one’s pen by mistake or pouring too little water into the kettle :-)). 

My apologies were mostly triggered by overlooking or forgetting about something at work and at home.

Data drawing:
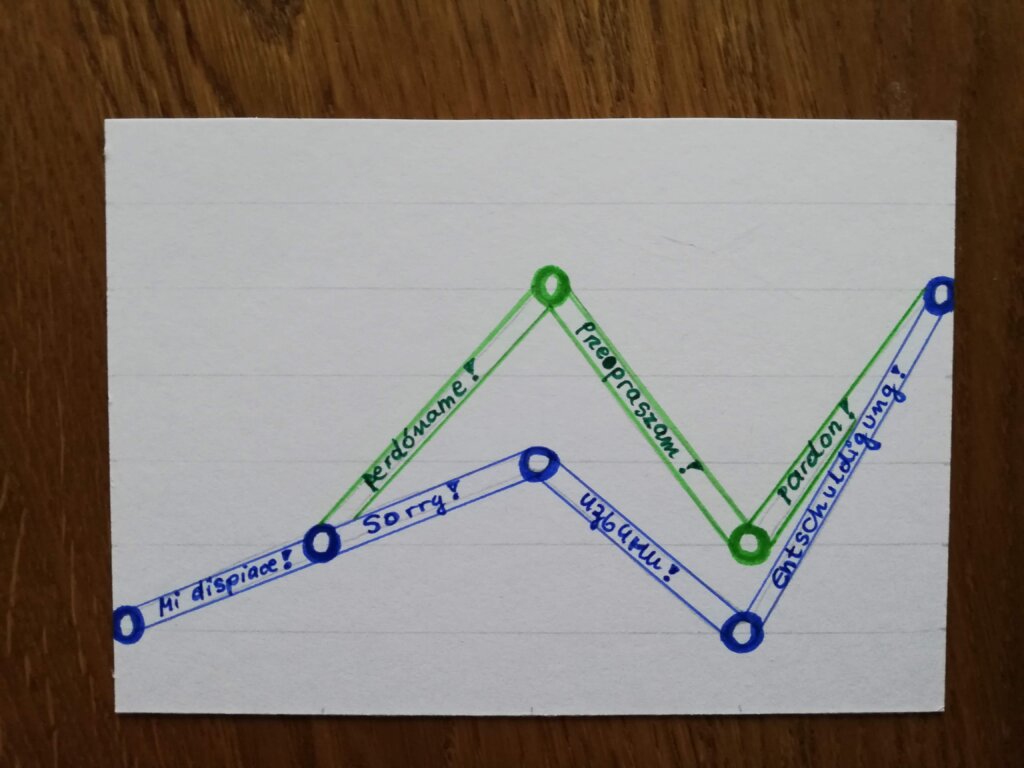
As I thought about presenting my modest data, the word sorry came to my mind in the various foreign languages I know. I even looked for websites with translations of the word sorry into all the languages of the world. Apparently I was looking for non-obvious inspirations.

As usual I was thinking about how to categorize my data. This week I only got two categories: 1) minor errors / omissions and 2) late arrivals.

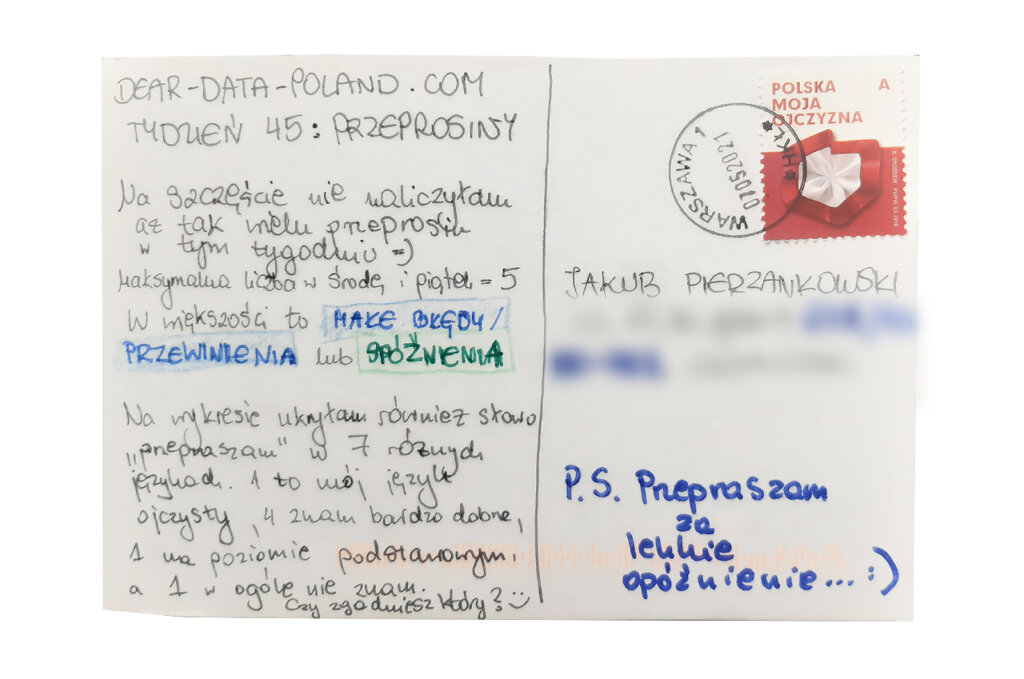
I decided to combine the stacked line chart with my linguistic hobby. I also hid a mini-riddle for Jakub in the postcard.

Jakub’s postcard:

It took me a while to decipher this unusual visualization 😉 It’s interesting that Jakub counted the apologies directed at him, I didn’t think about it…

The process:

Categories
Uncategorized

Week 44

Jakub

Topic:
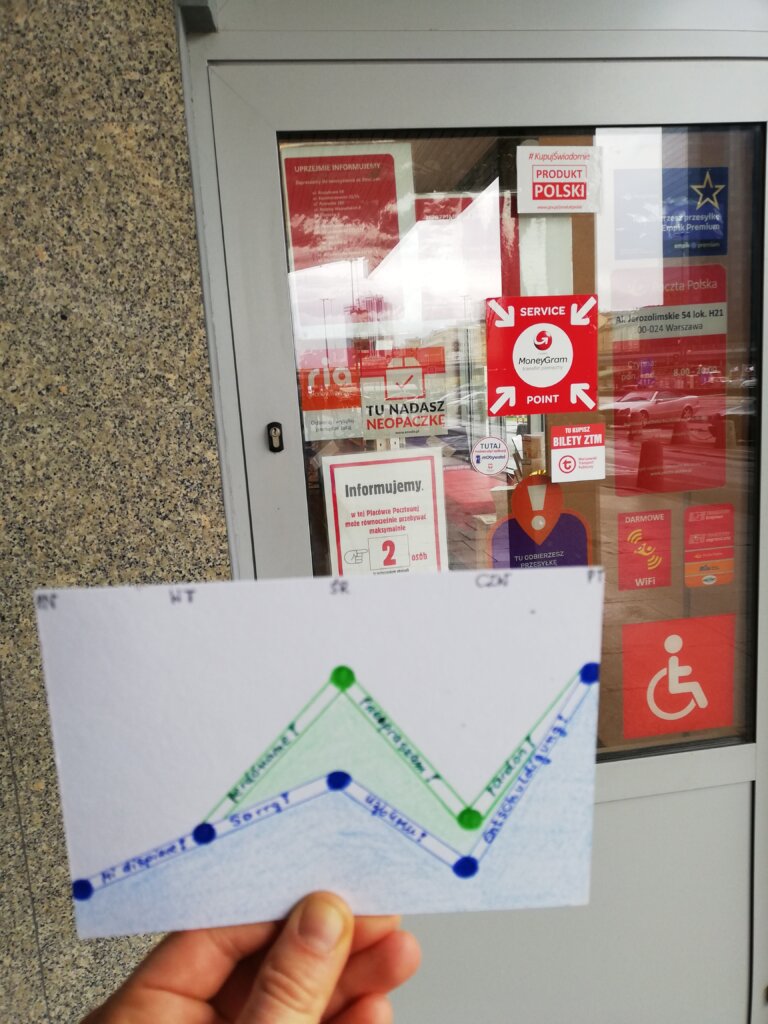
I am often distracted. It is mainly due to the nature of my work. As a rule, the marketing industry has an exceptionally wide range of tasks. I even heard a saying „If you don’t know who is going to do something, let the marketing department do it.” As a result, each day is different and often unpredictable. At least I am never bored. However, it is also a disadvantage – my priorities have to change often.

Data gathering:
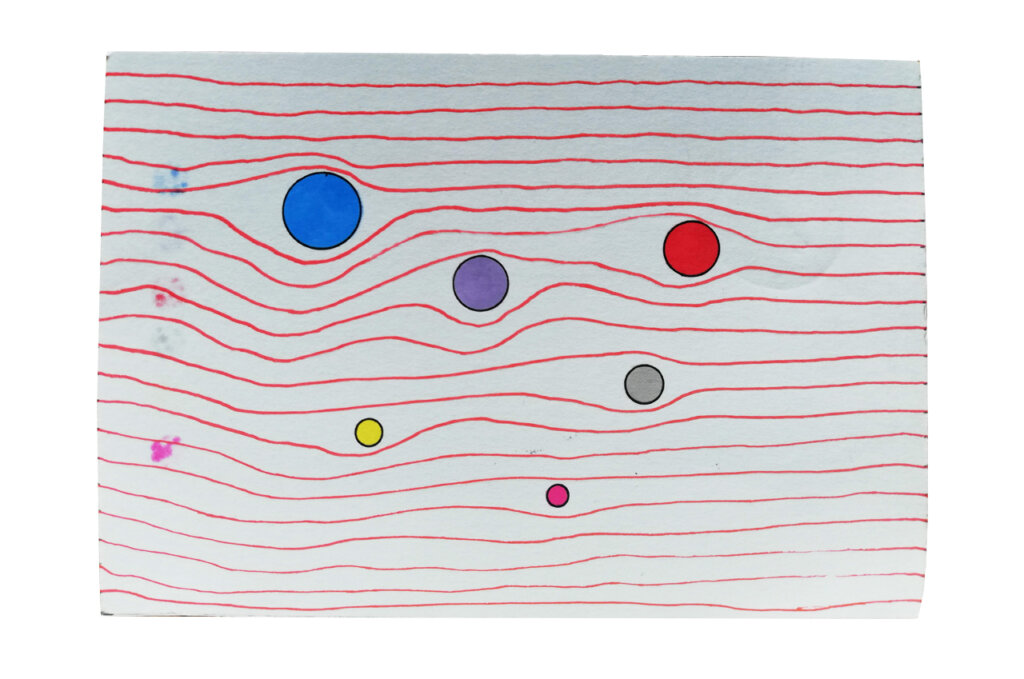
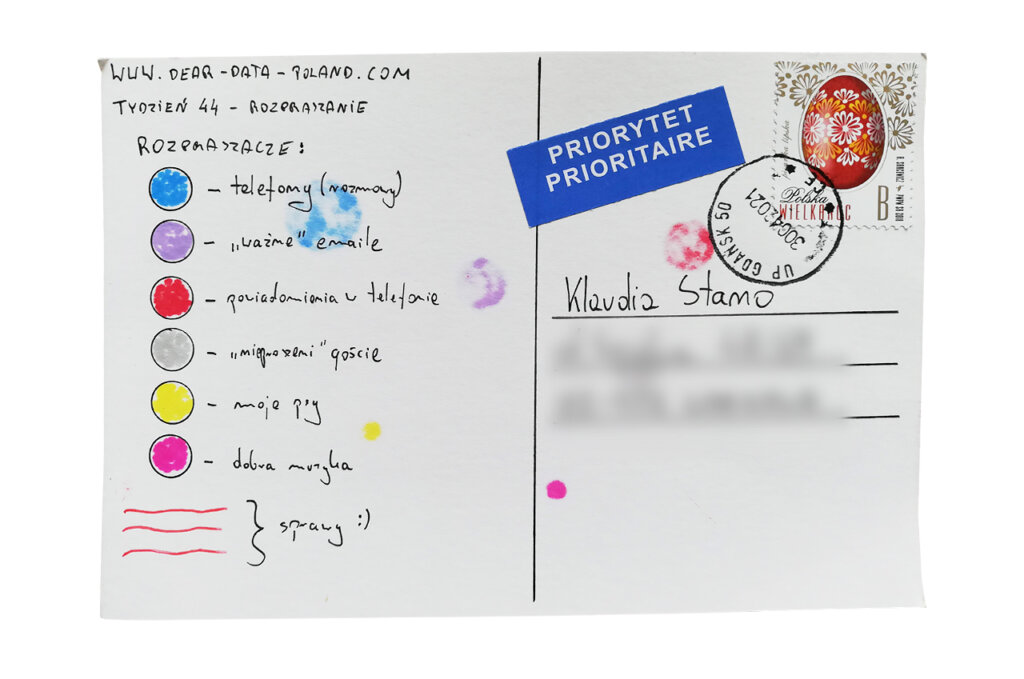
Data collection consisted in writing down each interruption at work and its source. I used Keep notebook. Pretty soon I noticed some patterns. Firstly, I am distracted by phone calls. At work I often contact my colleagues by phone. These conversations interrupt my flow and, worst of all, they are a source of new tasks. Secondly, I can’t help but read new emails as soon as they arrive in my mailbox. Those messages often require immediate action, which distracts me from the work I have already started. Thirdly, it happens to me that I am distracted by music heard on the radio, because I want to check some data about the artist.

Data drawing:
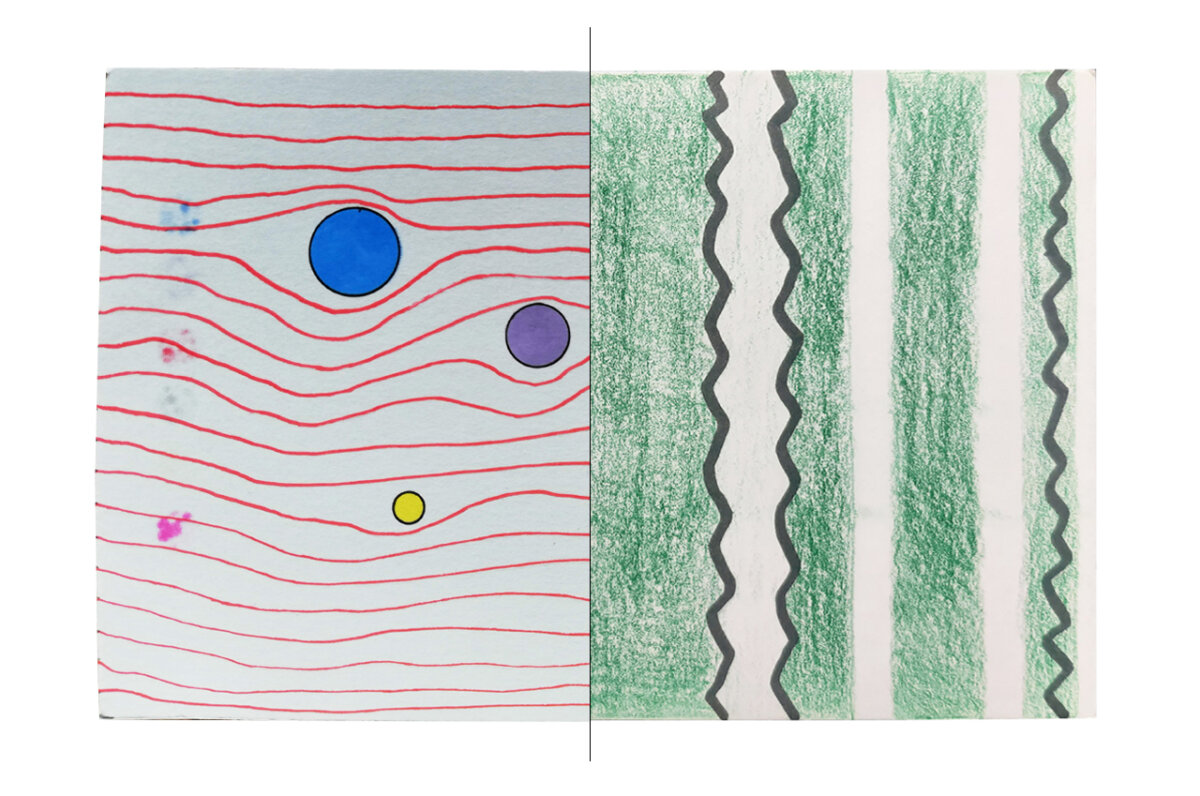
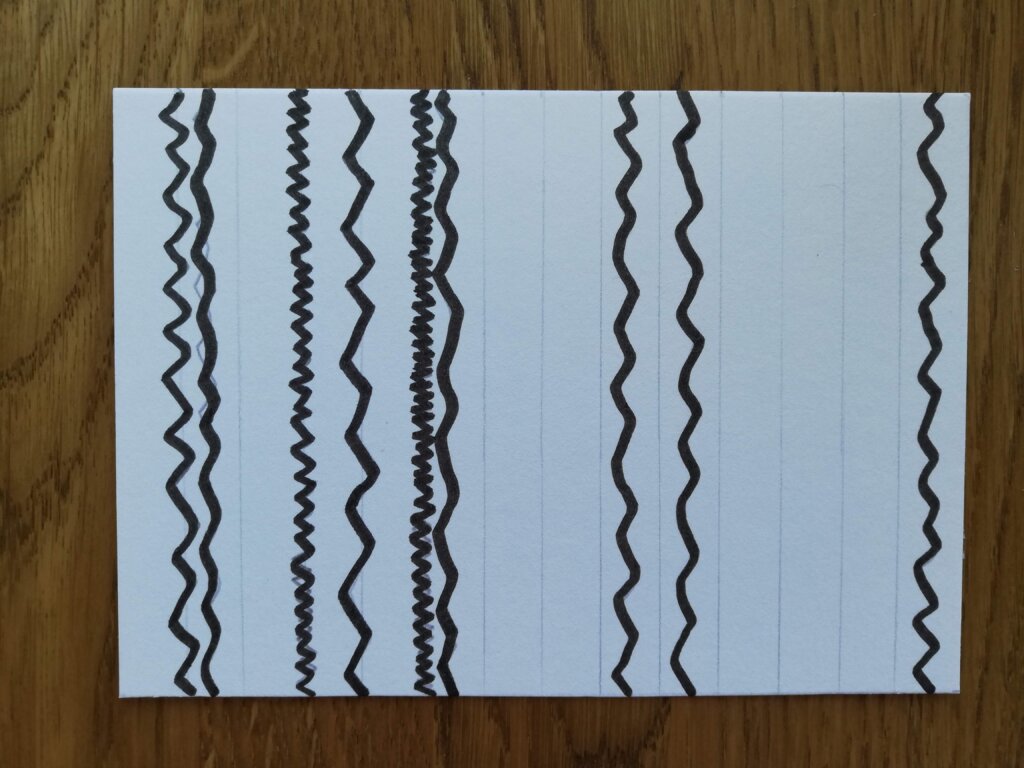
I wanted to show that the course of things is never perfect. There are always some obstacles or distractions. Some smaller, some bigger. The key is to accept that such interruptions will arise and treat them as challenges.

Klaudia’s postcard:

Klaudia’s postcard presents the daily distractions in an interesting way and how they impact the quality of work. I think that for me there would be much less deep work and more shallow work.

The process:


Klaudia

Topic:
Being focused as much as possible is my daily struggle. Sometimes I’m happy with what I achieve without being distracted too much. Sometimes there are days when a lot of time passes through my fingers.

For several years I have been testing various methods to focus more deeply. What helps me the most is weekly and quarterly planning, time-blocking my time, using Trello and apps blocking social media and websites. I also regularly listen to productivity podcasts to keep my motivation high.

I feel that my ability to focus gets better every week and every month, but this process is all about highs and lows. And I have the feeling that this battle will never end.

Data gathering:
For the whole week I had an open notebook in front of my monitor. I noted down moments of distraction, i.e. a ringing phone, a new message from colleagues or my thoughts wandering to somewhere else. 

In the end I decided to use only Monday data. This day was terrible in terms of distractions and I hope it will not repeat often. Even though I worked 12 hours, I ended the day in a bad mood.

Data drawing:
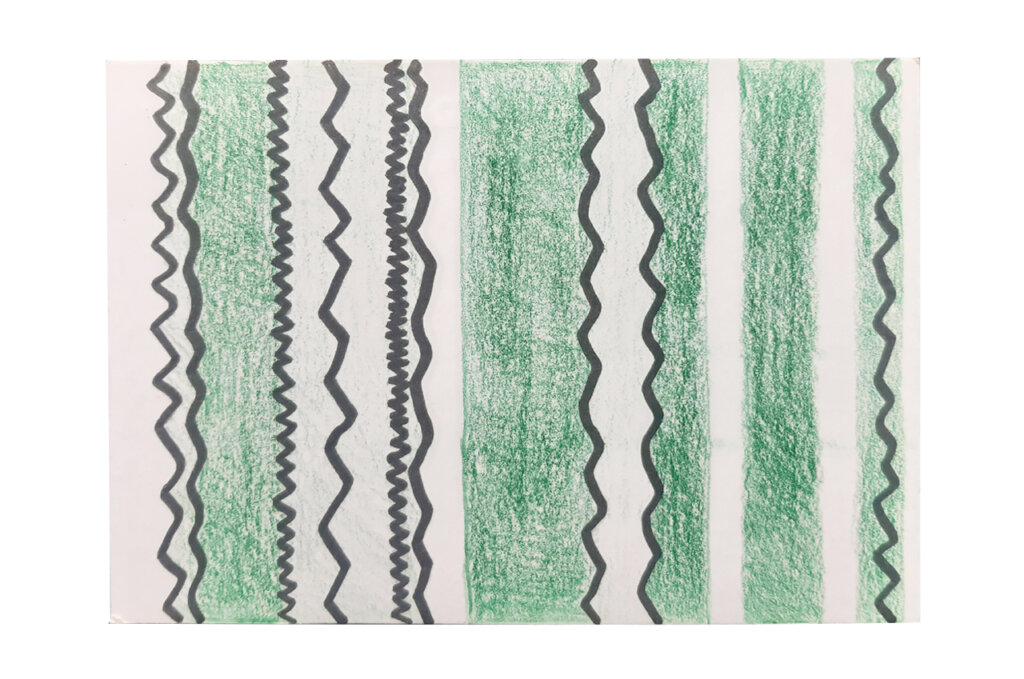
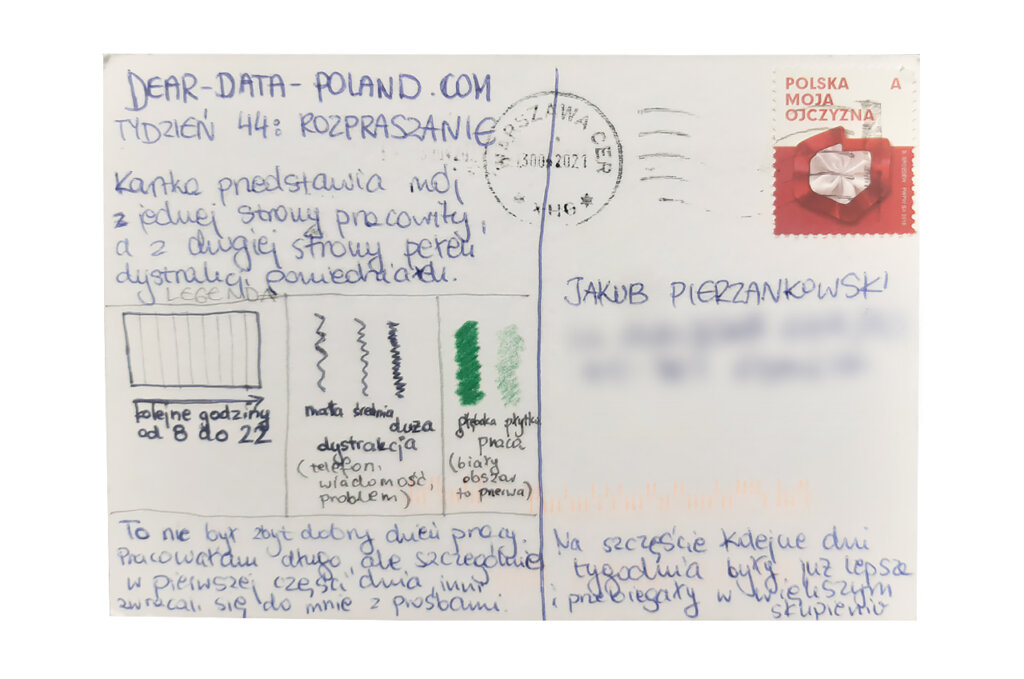
Distraction makes me think of a scratch, an obstacle. I knew exactly how I was going to draw this postcard. I knew there would be a series of cracks on my „Monday timeline”. 

I have additionally marked sections of deep work, relatively free from distractions (in deep green).

Jakub’s postcard:

Jakub’s postcard accurately shows how we have to deal with urgent distractions every day and that it is impossible to just avoid them without changing plans 😉 No day is as simple as we plan it.

The process:

Categories
Uncategorized

Week 43

Jakub

Topic:
I like trying new things. Even in my youth I experimented with controversial fashion or crazy hitchhiking trips. I approached this topic with curiosity, because recently my life has been very schematic, especially when looked at from a one week perspective..

Data gathering:
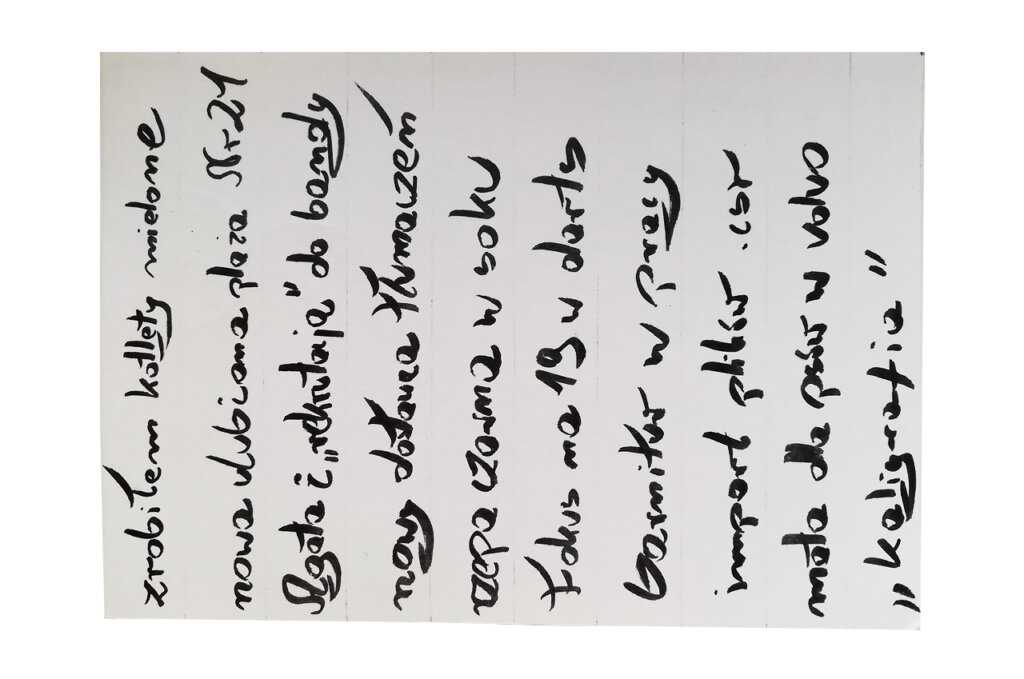
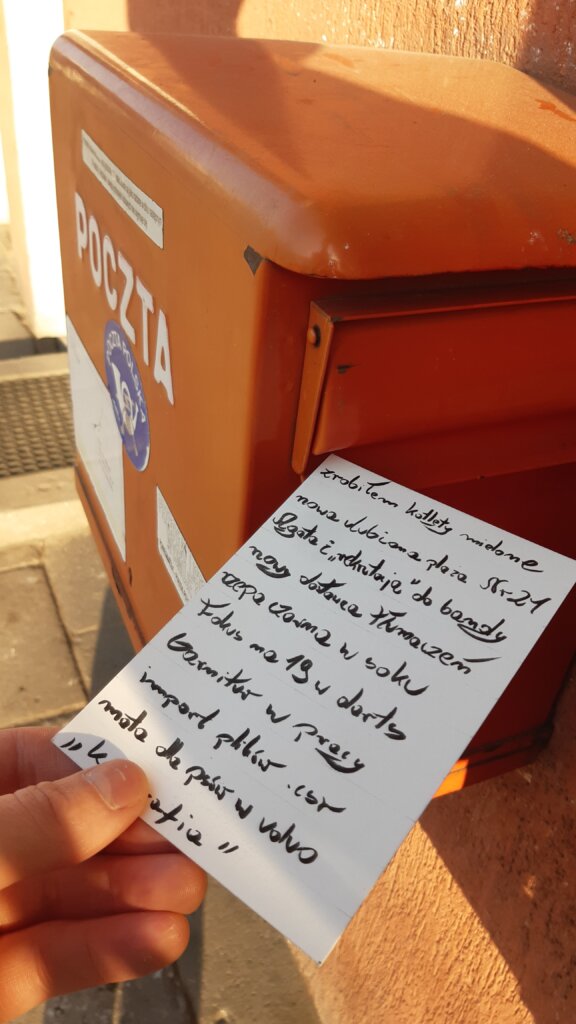
At the end of each day, I would write down one or two things that were new to me. This is how my short list was created.

Data drawing:
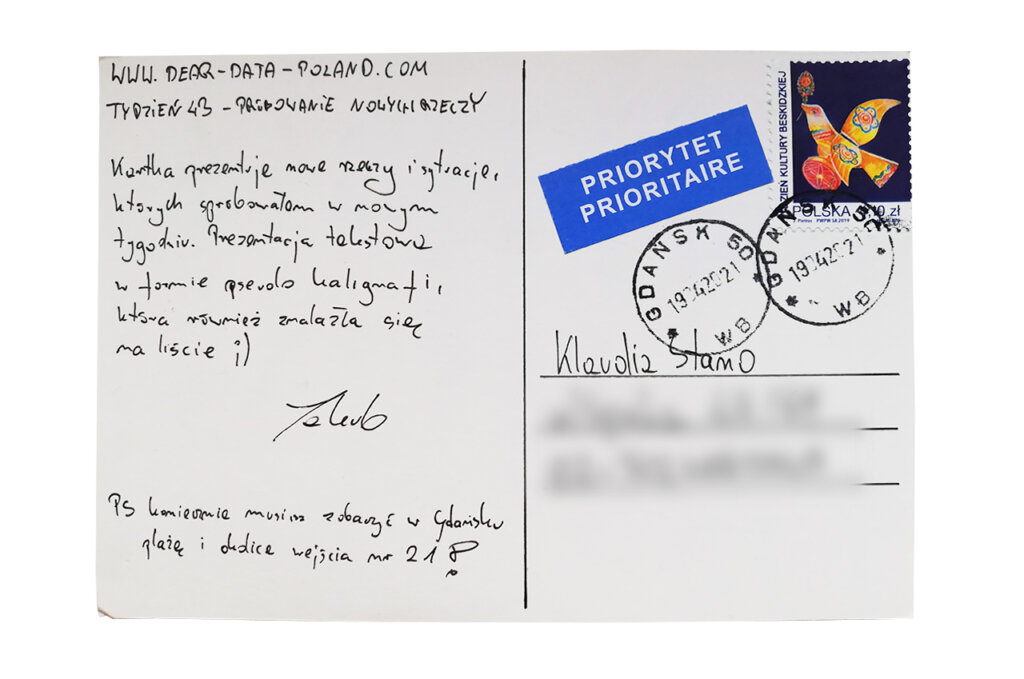
I thought that I would try something new while drawing this postcard (a brush pen) and this is how my pseudo-calligraphy was born 🙂

Klaudia’s postcard:

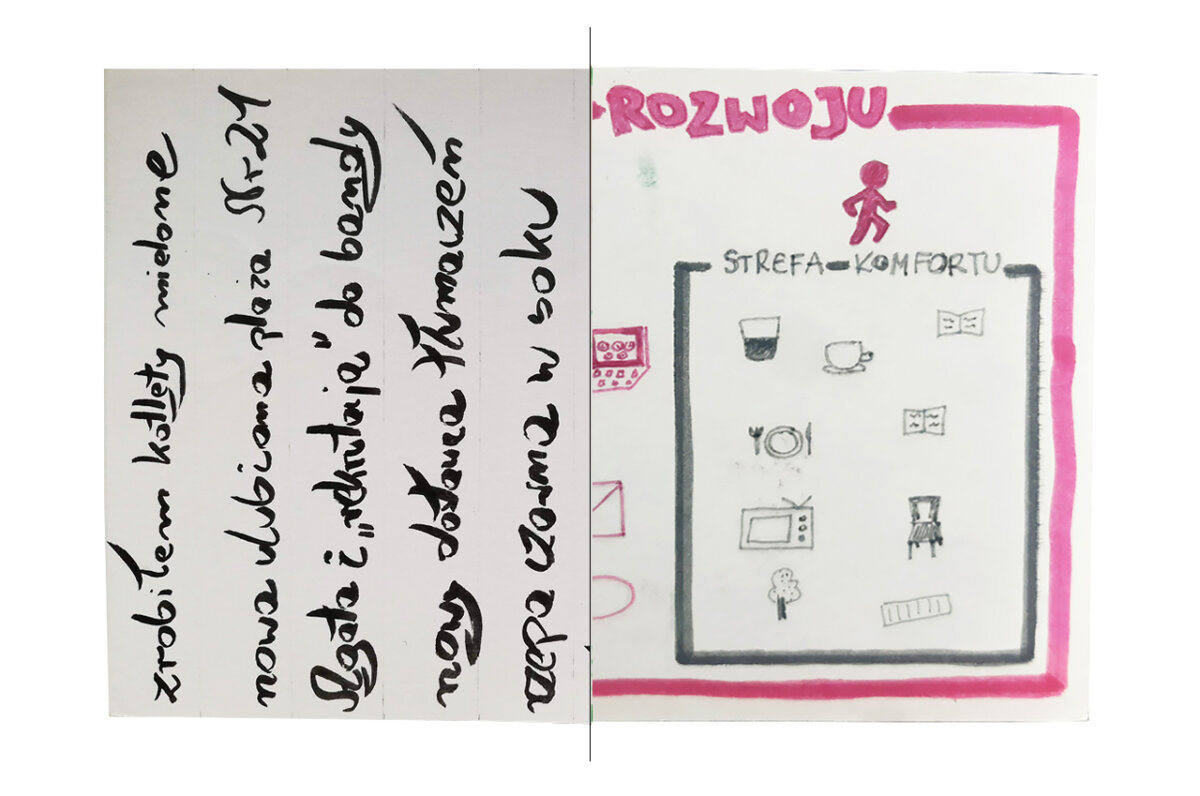
Klaudia’s postcard touches on much more serious topics than mine 🙂 I am very happy that this week was revealing for her and resulted in new resolutions regarding the comfort zone.

The process:


Klaudia

Topic:
The subject seems to have been created for me. I love novelties. New projects, new challenges, new discussions help me grow and allow me to move forward. It mainly applies to my work in NGO and data visualization. Whenever I am bored or become settled in a well-known situation, I look for new ways of doing things.

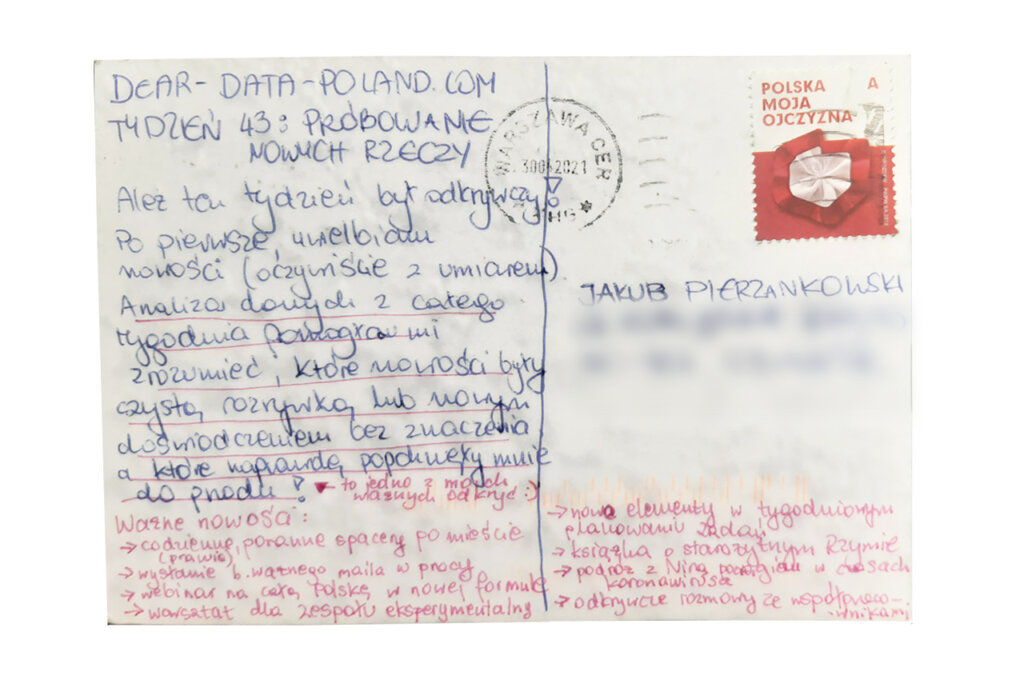
However, I have never before examined “new things” in a systematic way. I was looking forward to this week and… I was right. I have found that classifying new things happening in my life into those that I do effortlessly and those that scare me a little bit, is very refreshing and useful. Moreover, I want to introduce this division into my weekly and quarterly planning. I would like to do at least one or two things outside of my comfort zone each week

Data gathering:
I wrote down all the big and small novelties on an ongoing basis, starting with tasting a new type of coffee (flat white at McDrive), through morning walks around the city, and ending with sending a super-important email at work, for which I had been preparing for a long time with my colleagues.

Data drawing:
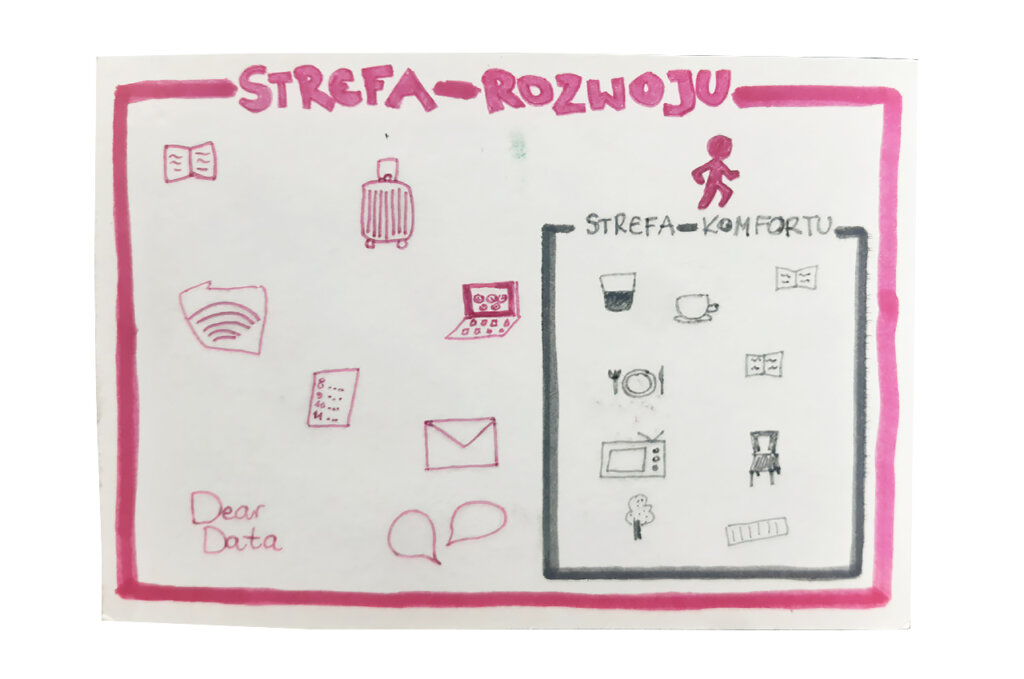
I looked at my data and at first glance I noticed that some records were trivial (tasting a new herring type :-)), and others were some kind of milestones for which I had to prepare, think intensively and have discussions with others.

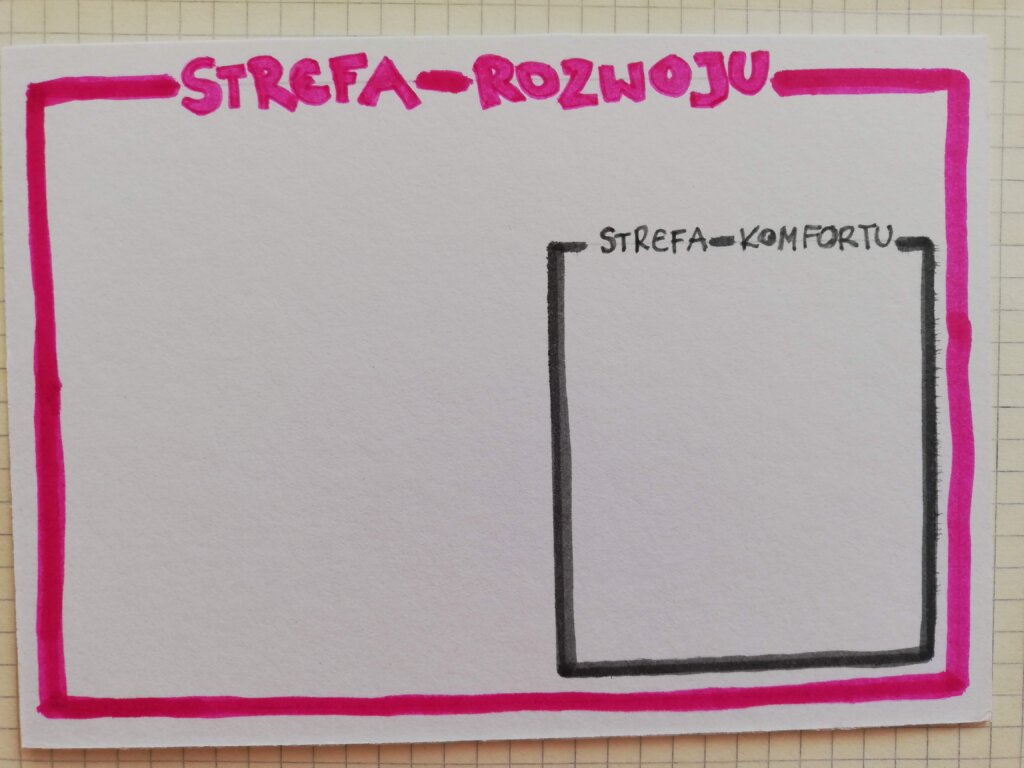
As I thought about how to show the data, I remembered one of the well-known development diagrams. According to this graph, we learn when we leave the so-called comfort zone and push our limits. I agree with it and I used this concept.

Jakub’s postcard:

I really appreciate that Jakub treated the postcard as an opportunity to try something new.

By the way, one item on my list is similar to black turnip juice – I tried pickled beetroot juice (yummy!).

The process: