Jakub
Topic:
I like being alone. I remember that when I was preparing for a triathlon, I really appreciated the moments of solitude while running, cycling and swimming. It was a time of reflection and just a break from wearing a mask in relationships with others. This week has proved that lately I haven’t had too much time on my own.
Data gathering:
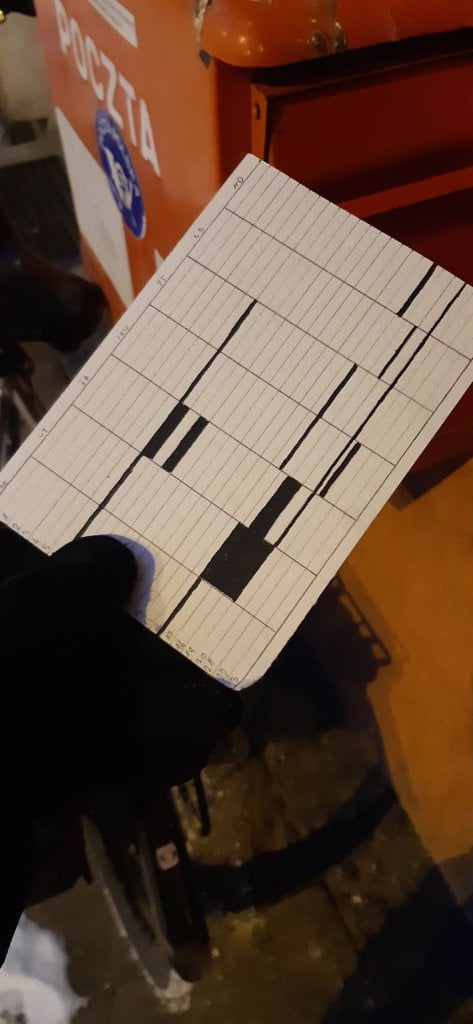
Every evening I analyzed my day and wrote down the exact moments of being alone. It was usually a recurring pattern: commuting to work, walking the dogs, etc.
Data drawing:
I used a very simple calendar-like diagram. The periods spent on my own are marked in black. Simplicity of communication 😉
Klaudia’s postcard:
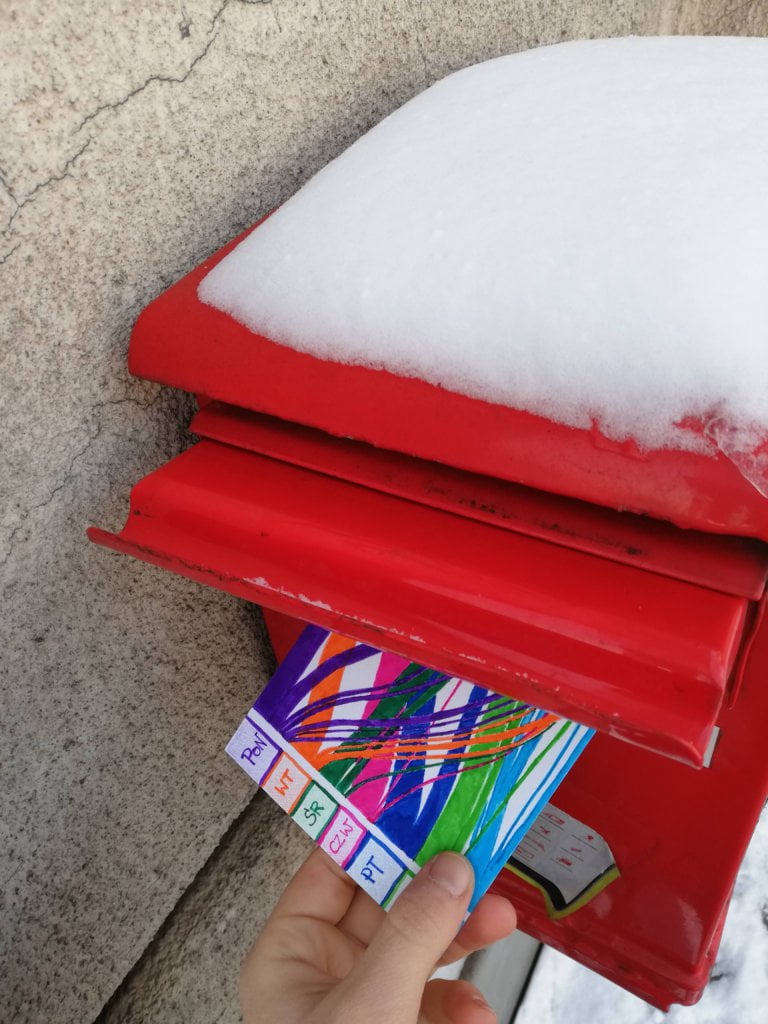
Klaudia impressed me. Drawing a Sankey diagram on the postcard is really something. Respect! I can see that it cost her a lot of time. I like it very much. I think this card is a pretender for the most interesting postcard of our Dear Data project edition;)
The process:


Klaudia
Topic:
Being alone is my every-day reality. I enjoy solitude and appreciate every moment of it. I’m an introvert, so I get my energy from being alone. I love to wrap myself in a blanket and spend the evening reading a book. I also like to work alone (although in a perfect setting I would like to spend 1-2 days a week with my colleagues, which is now impossible). Despite many hours of solitude, I do not feel lonely. As a mother of a 3-year-old I do not complain about the lack of company in the afternoons or on weekends. I also try to stay in touch with family and friends (as far as the current situation allows). It’s good that we can at least meet for a walk 🙂
Data gathering:
Every evening I wrote down how much time I spent alone and what I was doing. Of course online meetings counted as social time. In total, I counted 58 hours of pure solitude.
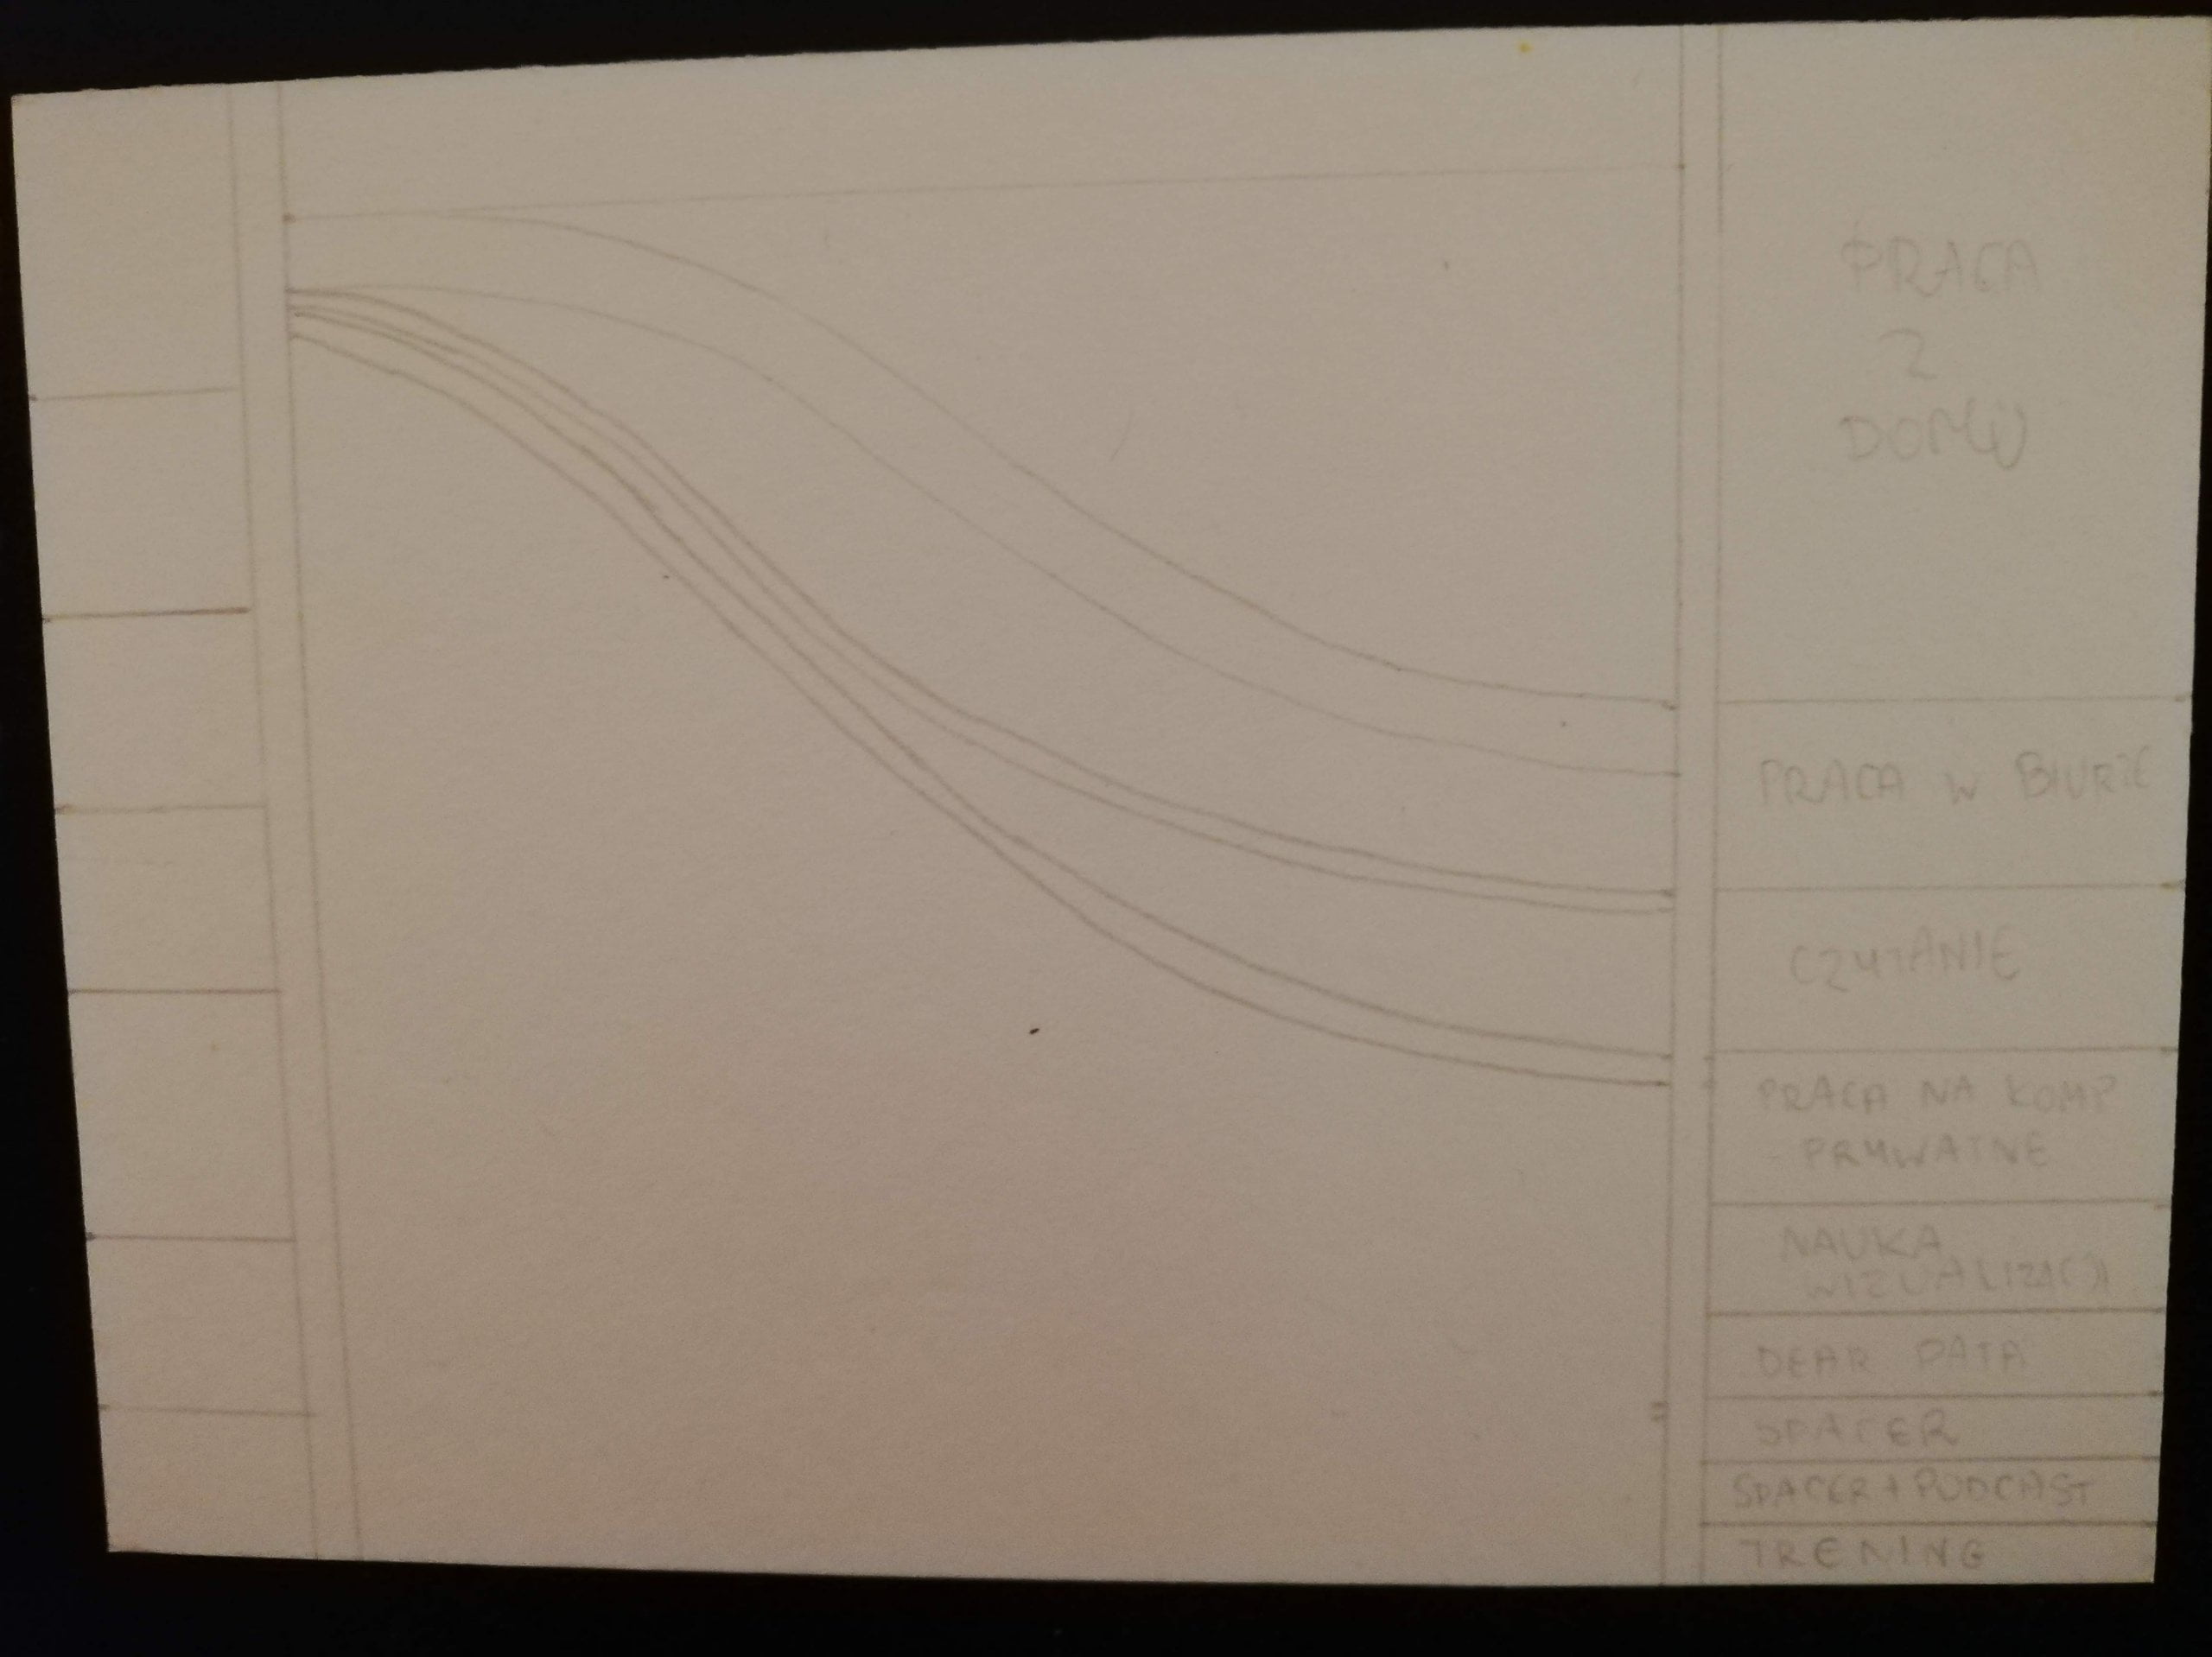
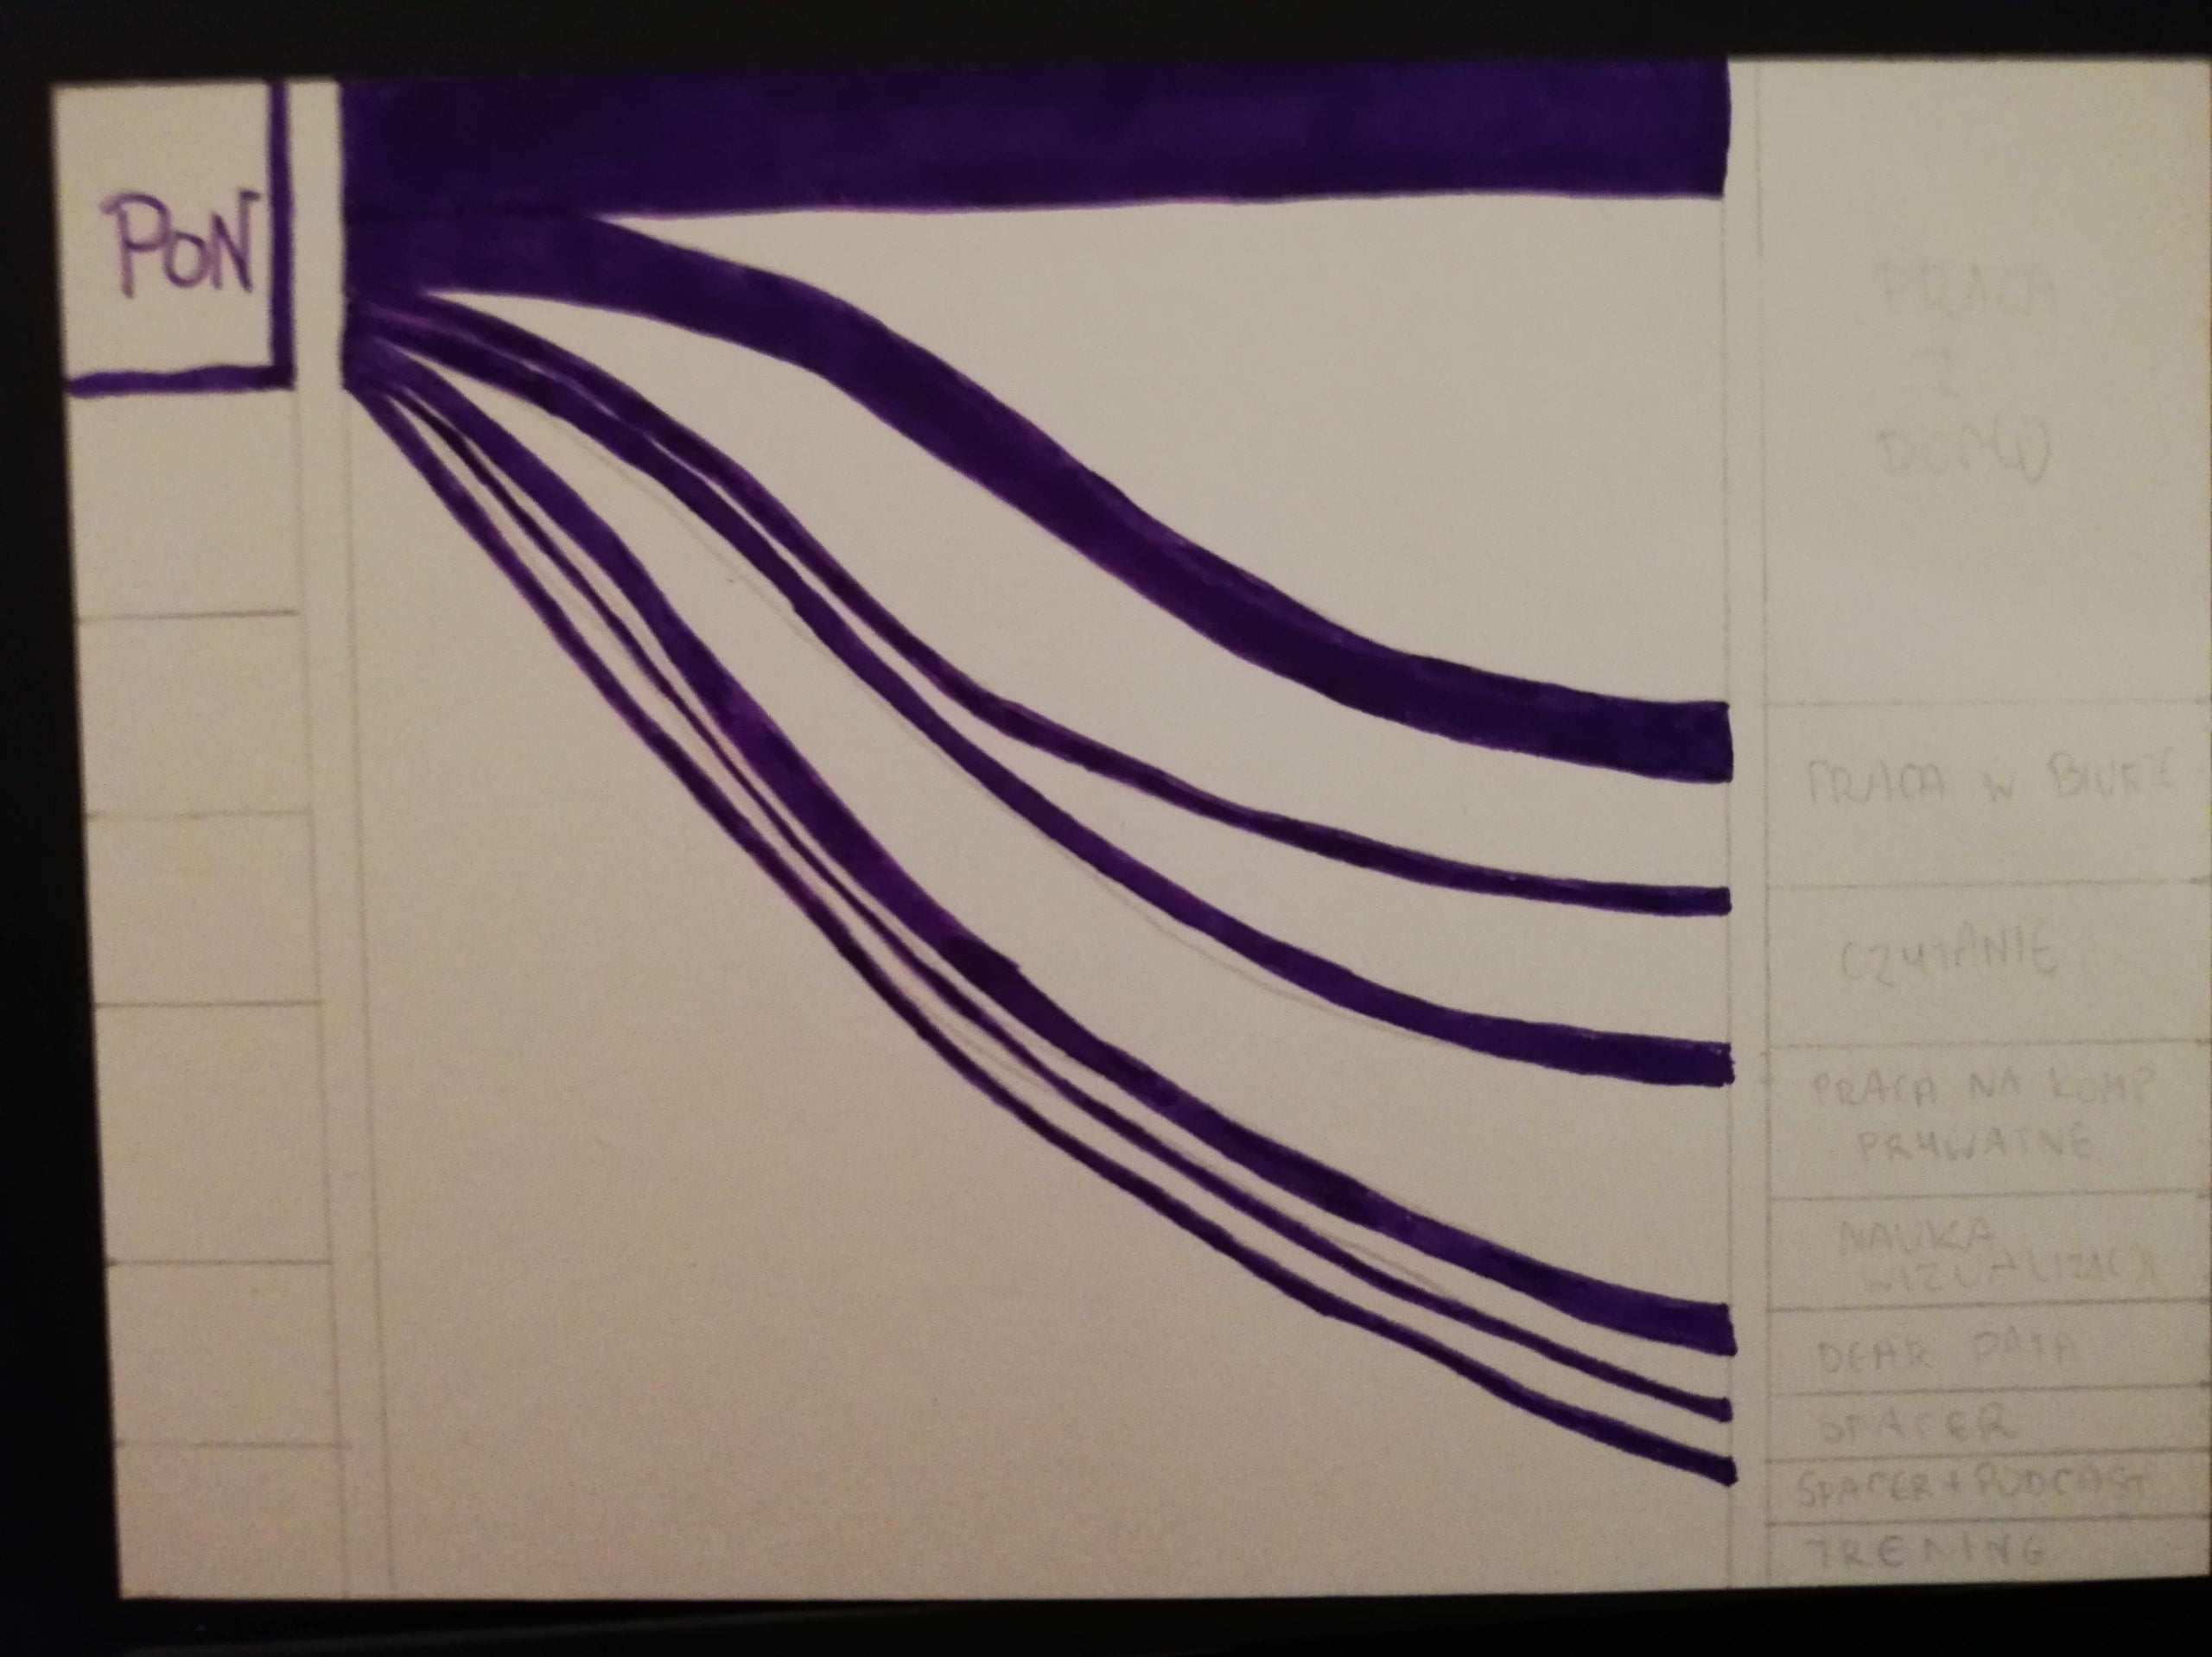
Data drawing:
Due to my involvement in the Career Map project, this week I have carefully studied the World Economic Forum’s report on the future of jobs. I was very impressed with one of the flow charts. On Sunday, when I was analyzing my data, I thought that it was pretty suitable for a Sankey chart. Well… 3 hours later my postcard was ready. This is the most time-consuming postcard I have created so far.
Jakub’s postcard:
I like Jakub’s postcard – simple and clear solutions are the best. I also like black and white visuals. I was surprised that Jakub spends so little time alone!
The process: