Jakub
Topic:
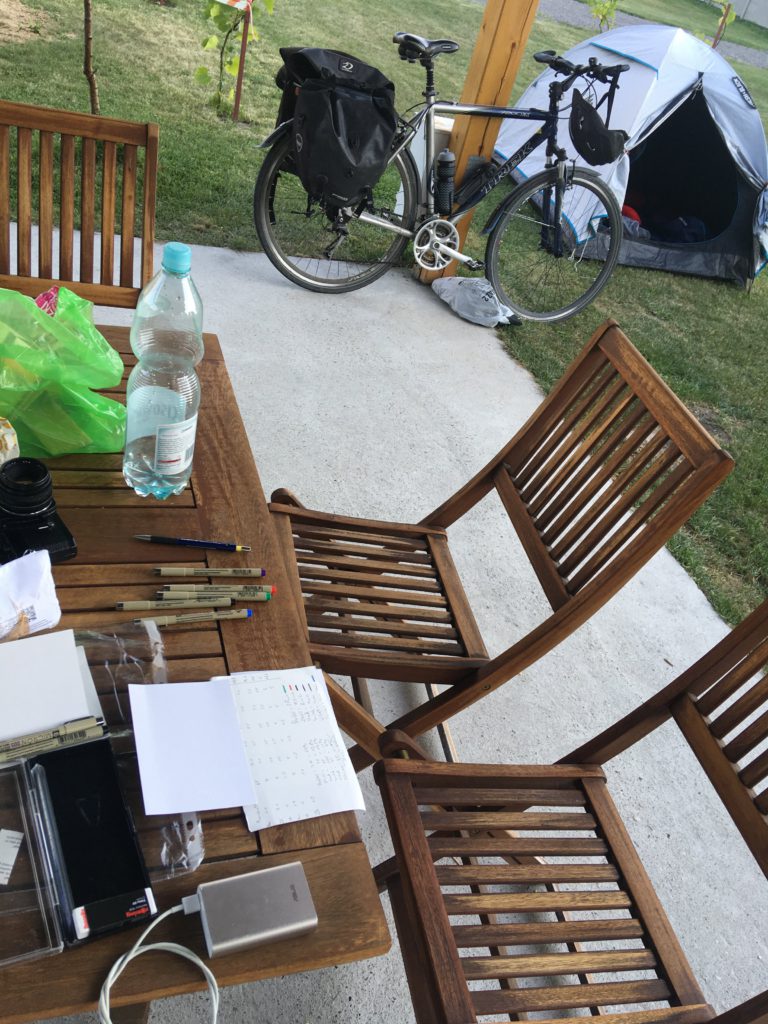
Emotions. This topic was right up my alley. I love psychology and analyzing the behaviors of people around me. But this time, I had to focus on my own emotions. This was a week of a bike trip and I was making 100 km a day. I had very few encounters with other people. So I had a lot of time for self-reflection.
Data gathering:
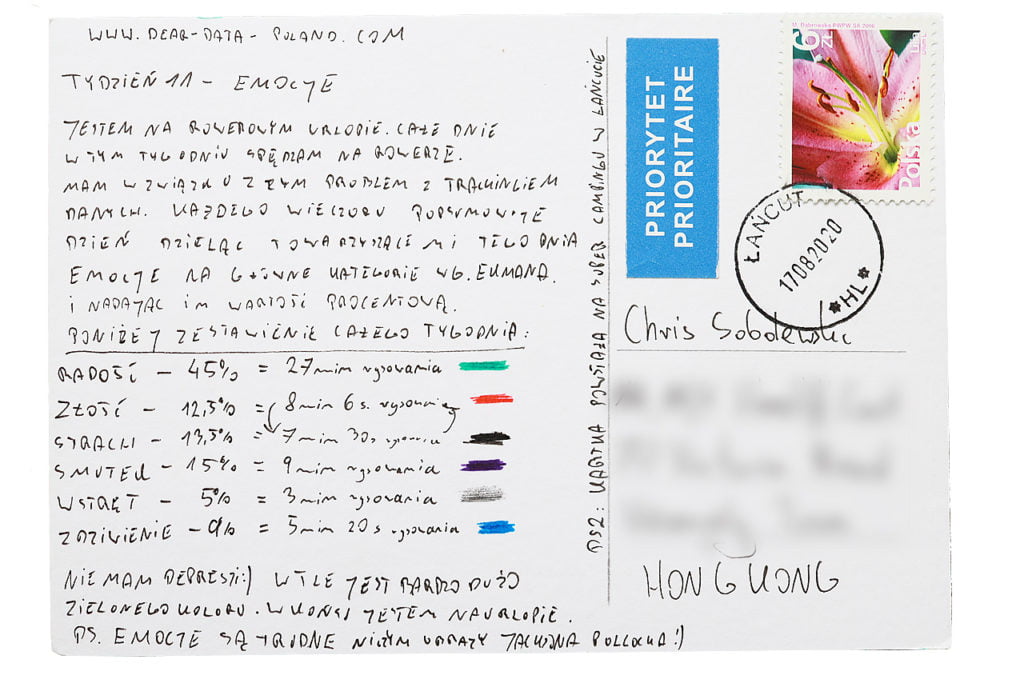
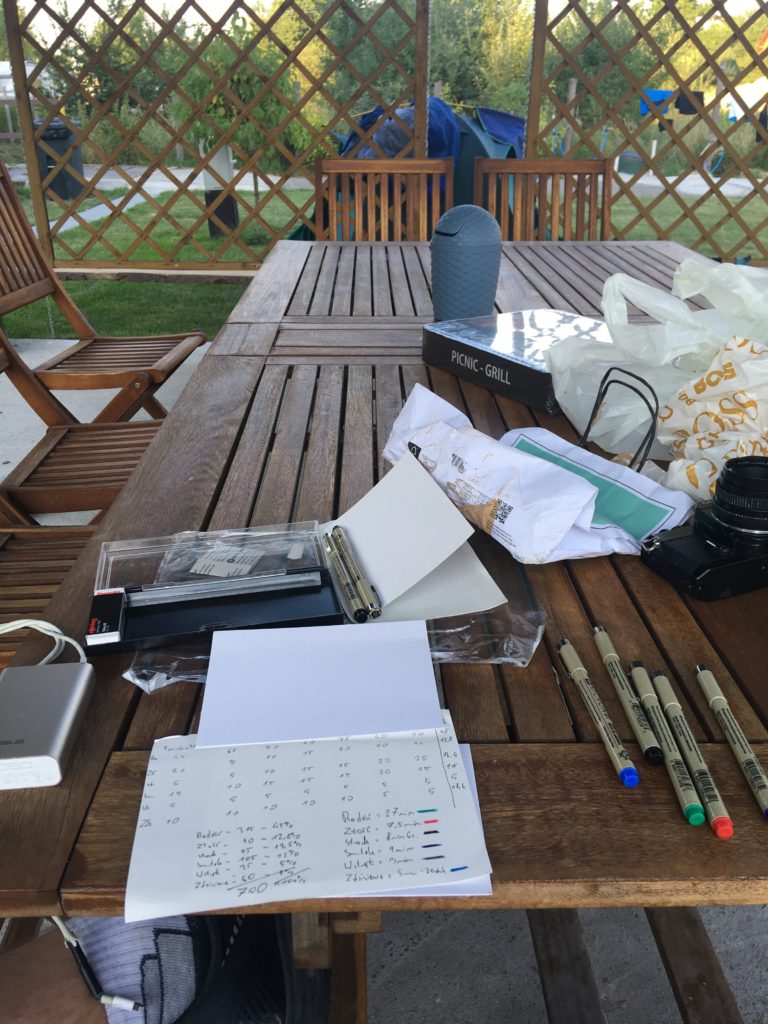
It was difficult to take notes while on a bike! So every evening before going to sleep I was writing down the percentage share of each emotion category (per Ekman’s categorization) that I experienced during the day. Those included joy, anger, fear, sadness, disgust, and surprise.
Data drawing:
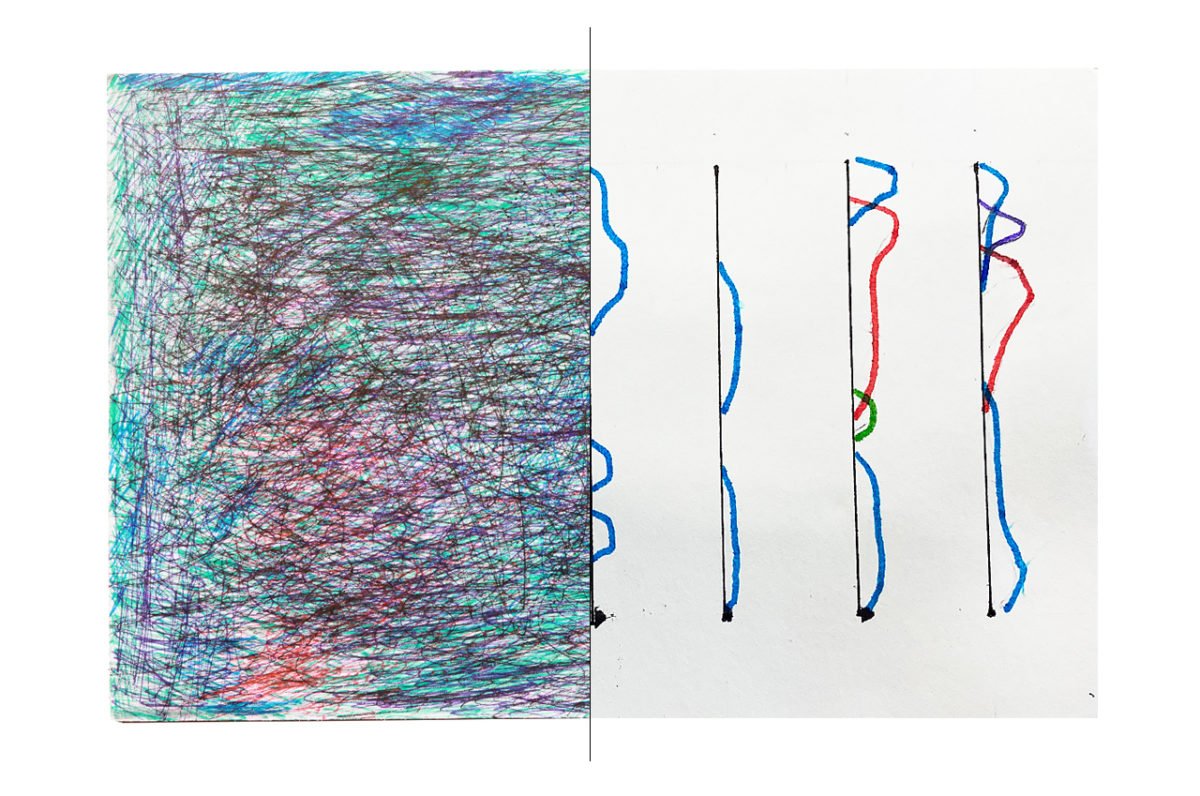
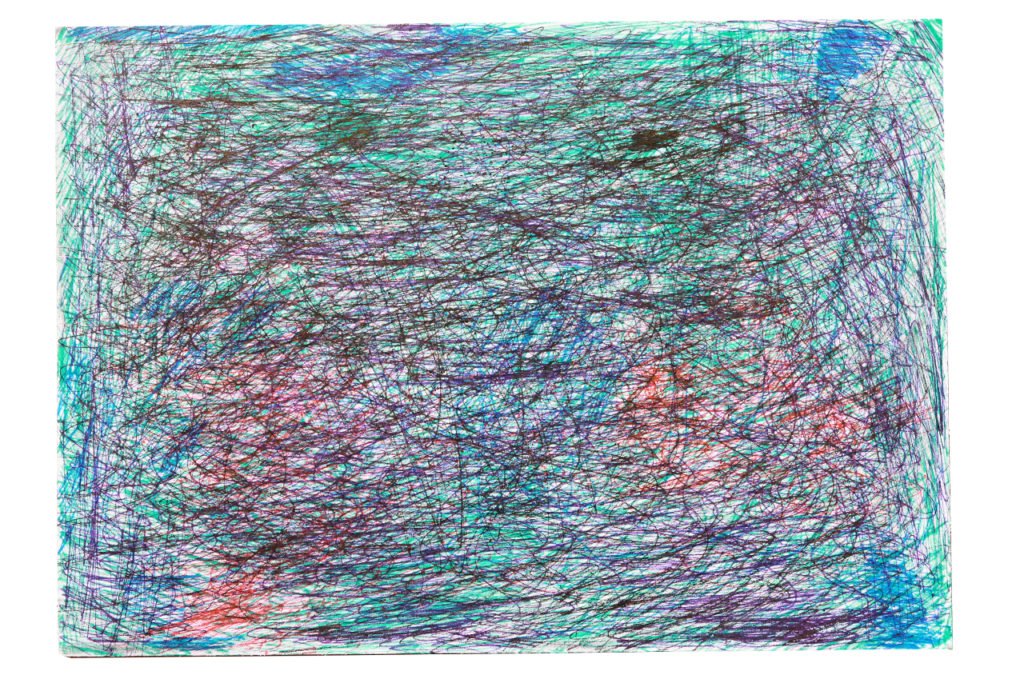
I had an idea how to draw this postcard even before this week’s assignment begun. I was inspired by the paintings of Jackson Polloc and wanted to fill the card with the colors of each emotion. The share of each emotion in the week was represented by the time I took to draw on the postcard.
The process:
Chris
Topic:
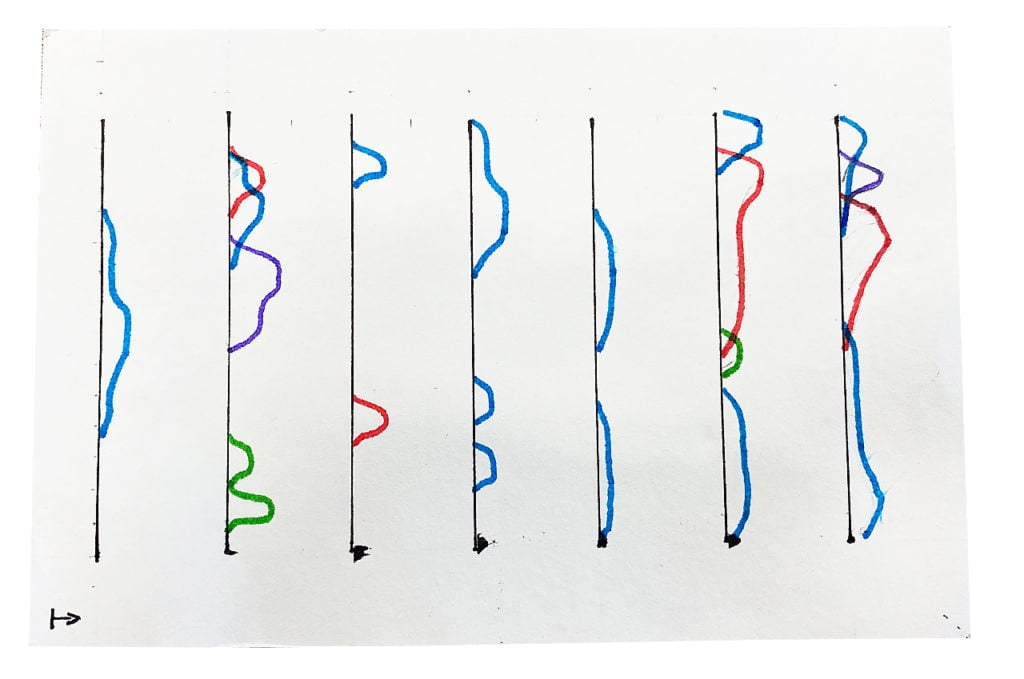
This week has undoubtedly taught me to pay more attention to my own emotions. And led me to a sad (sic!) conclusion that recently, most emotions I feel are negative.
Conclusions:
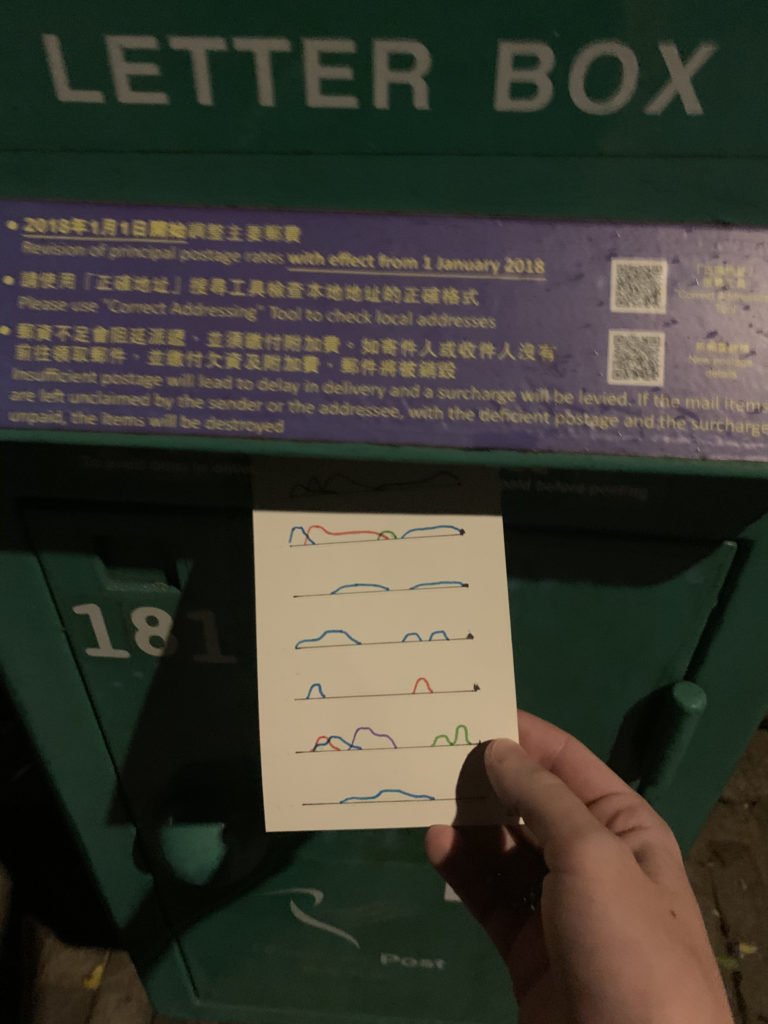
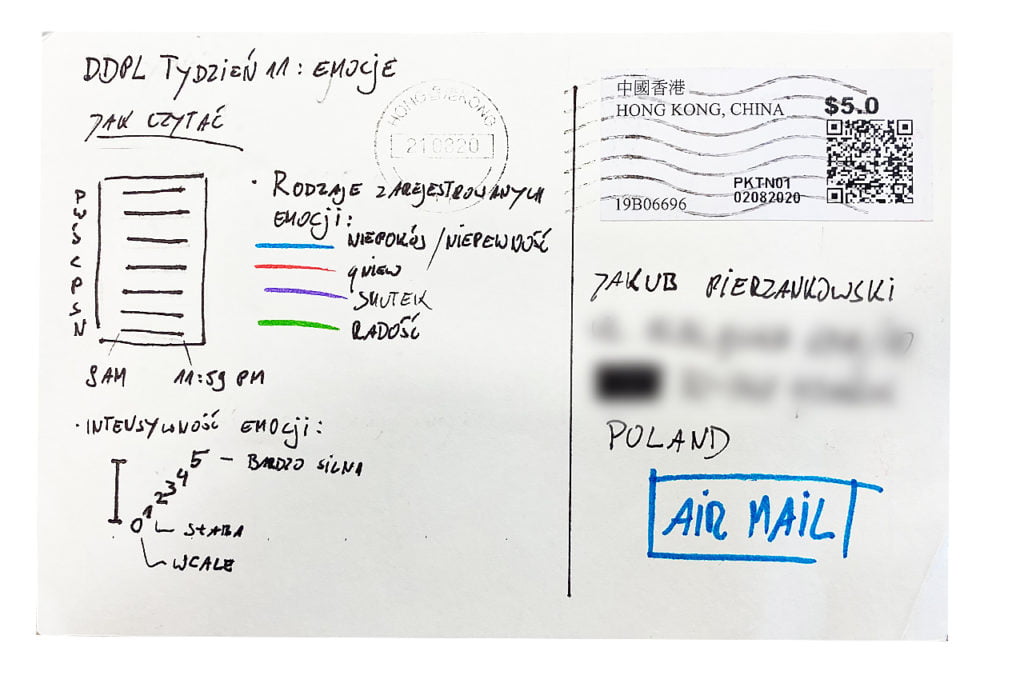
Blue color on the graph represents emotions connected to anxiety, fear, and uncertainty. There’s a reason this color dominates on my postcard from this week. Hong Kong is currently in the midst of the 3rd wave of the pandemic, with daily new case numbers in the triple-digits.
The uncertainty increases with every day. Even more so, as the renewed lockdown makes my new job even more uncertain.
This week, this anxiety has always been there somewhere in the background. And it made it easier for other negative emotions to surface — like anger and sadness.
Fortunately, there were some bright spots as well. Those are the green lines on the graph. Very few, but very important to me at the time.
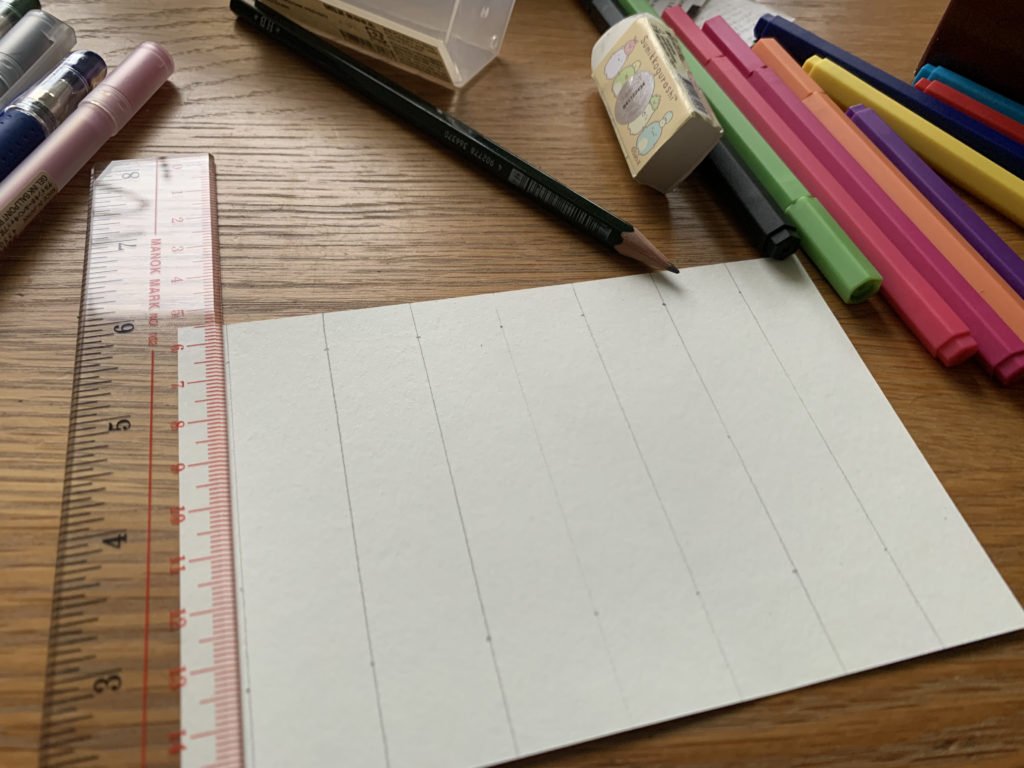
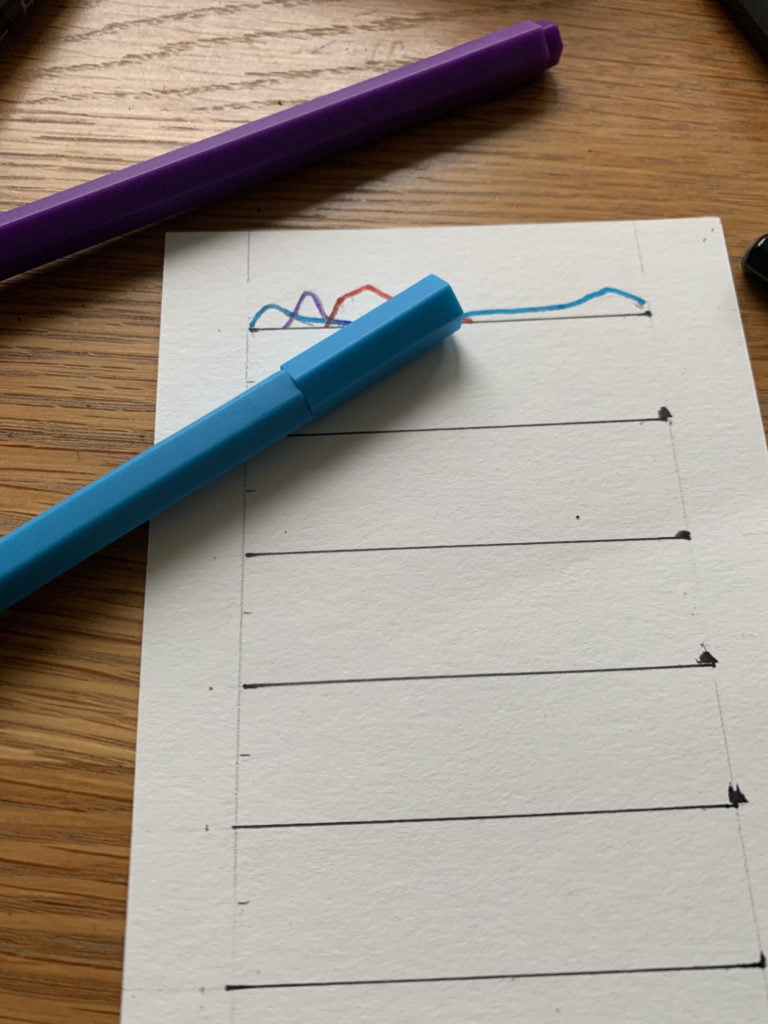
The process:
