Categories
Uncategorized

Week 02

Jakub

The topic:
I enjoyed this week’s topic — transportation. Firstly, collecting the data seemed less exhausting than the first one. Secondly, I work at a transportation company, so this was right up my alley!

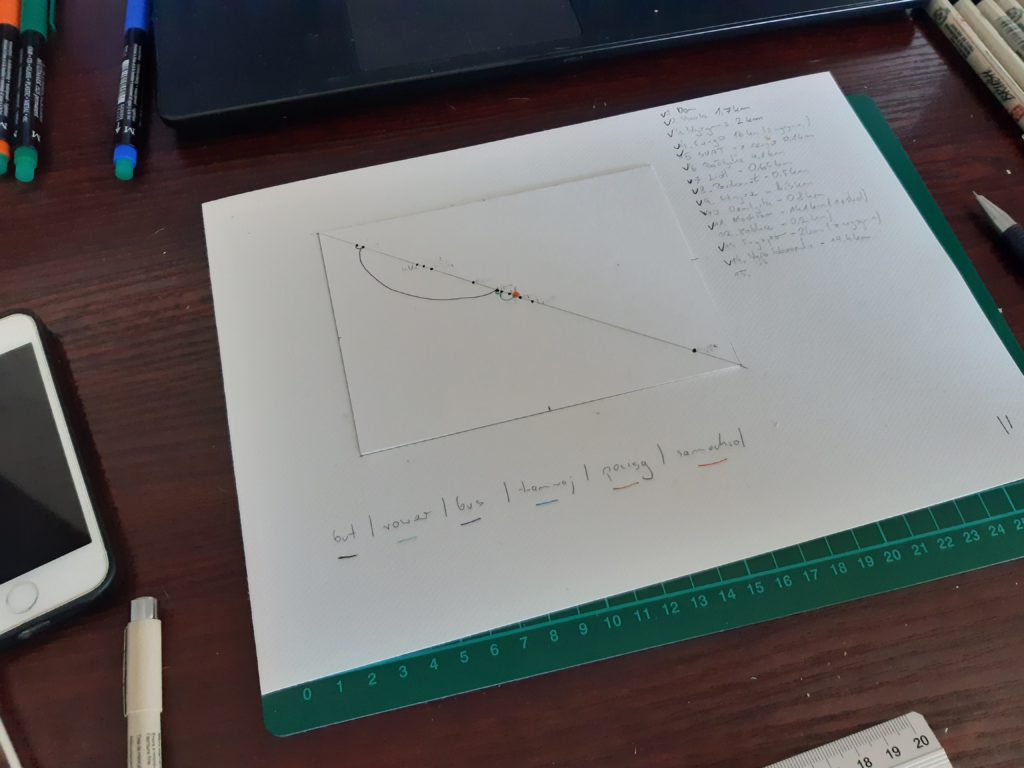
On a regular day I use many different modes of transport. I was curious in seeing how my “transportation week” will look on a postcard. That said, I dived into this topic without any specific design in mind.

Data gathering:
The plan was simple: record every trip, its origin, destination, and mode of transport. I would take notes on my phone as I went along, with an additional review in the evening to make sure every trip of the day was accounted for.

Data drawing:
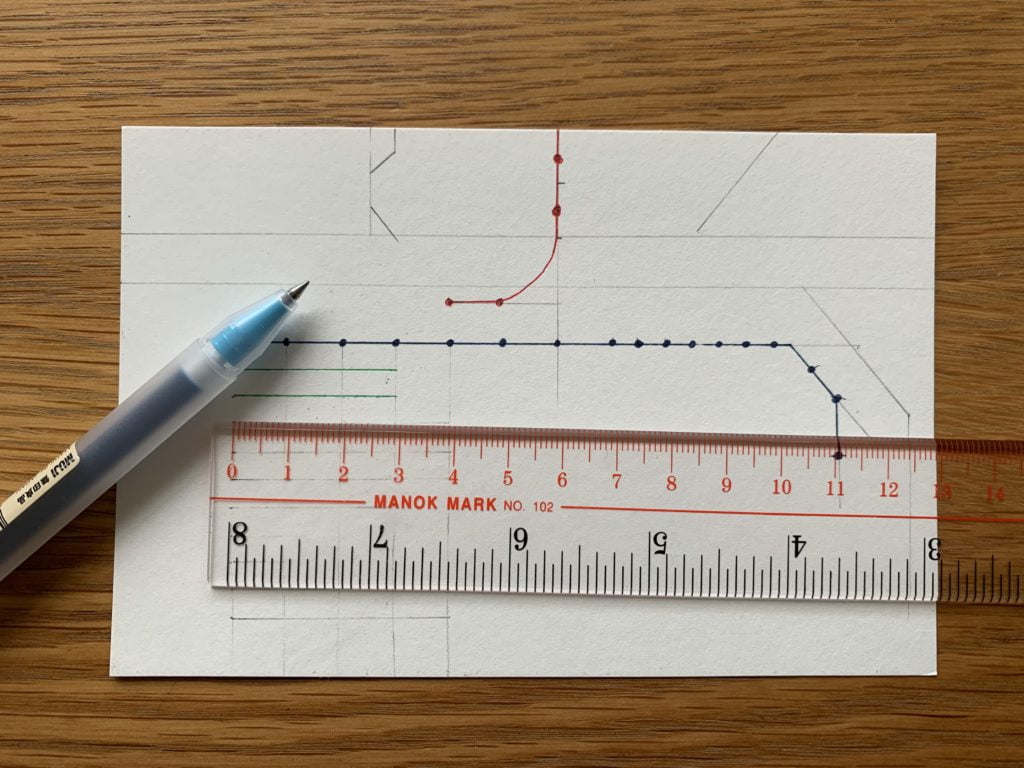
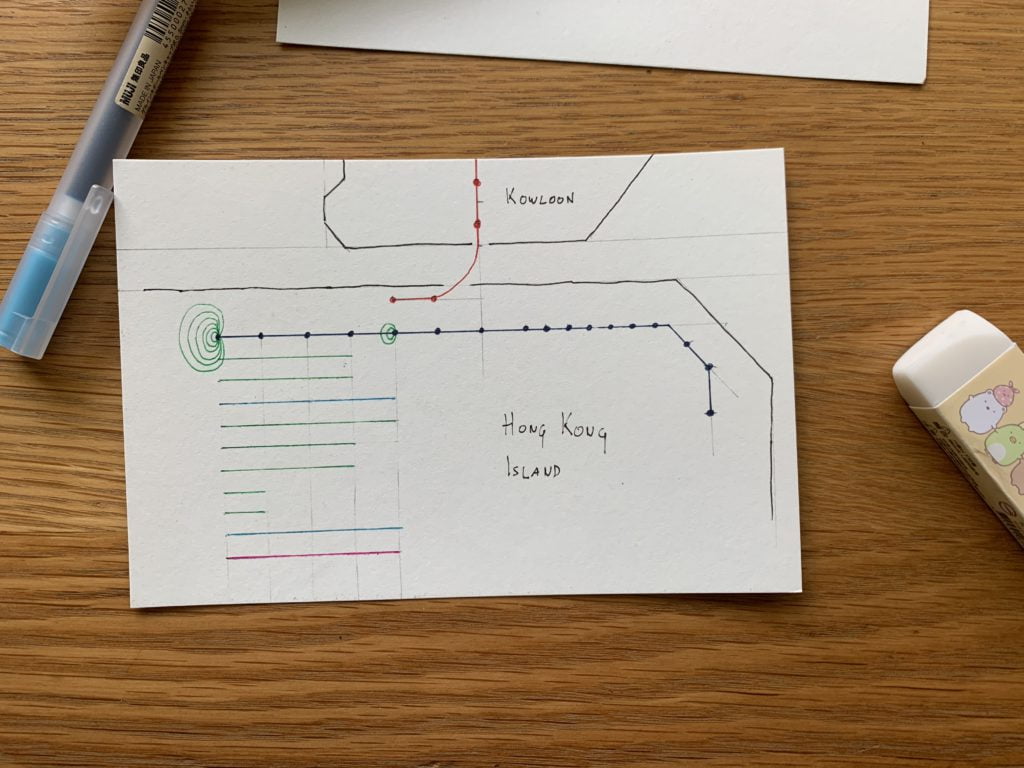
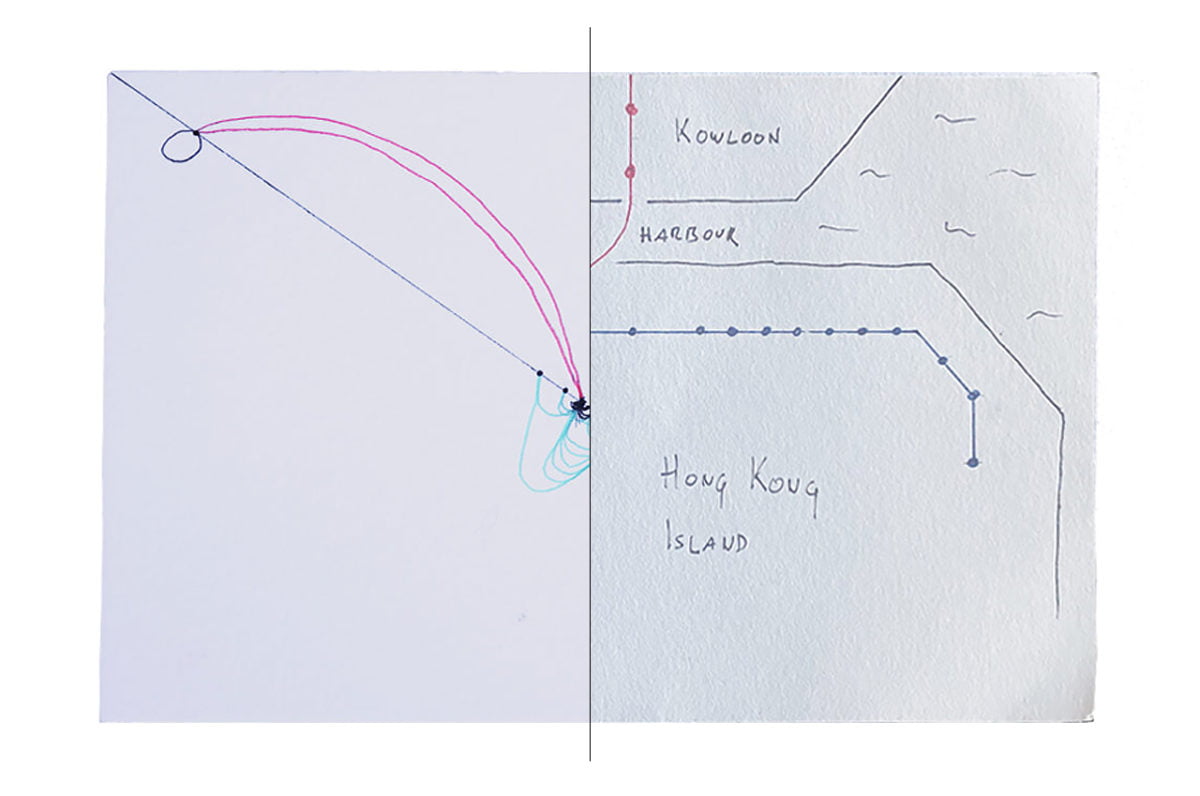
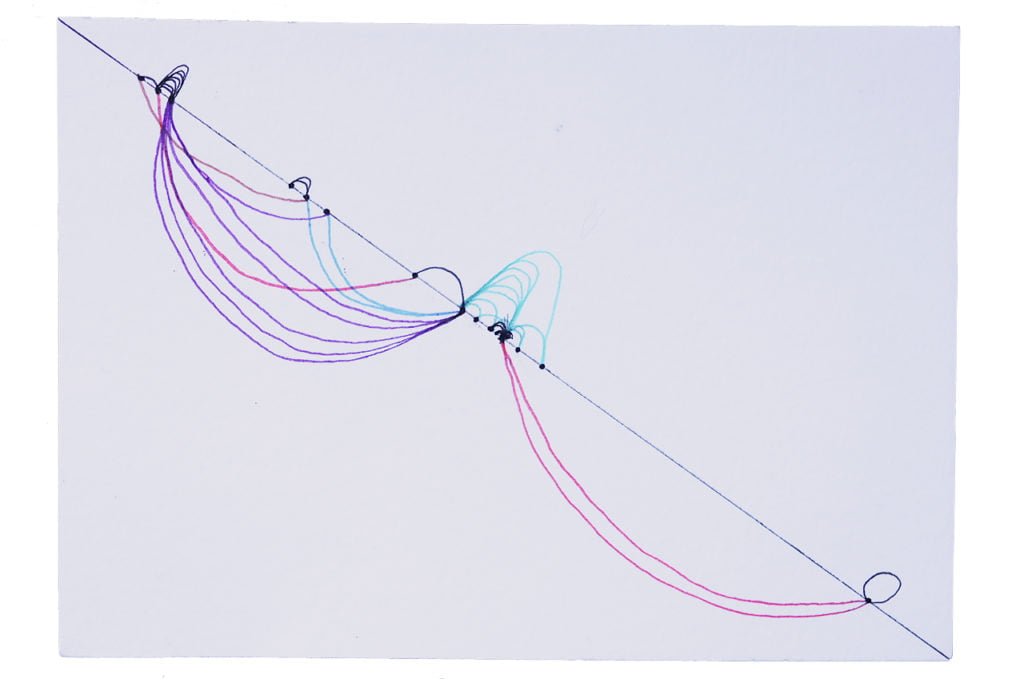
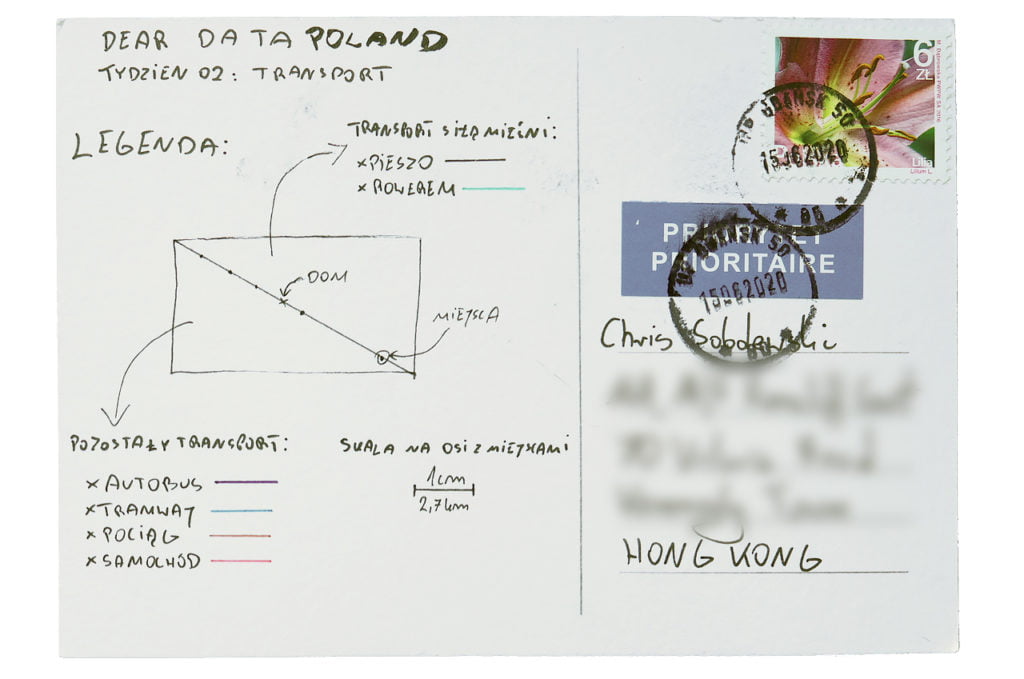
Postcard’s design crystalized just before I sat down to draw. Unfortunately, I didn’t have calipers (which would’ve been very helpful for this visualization), so I had to improvise. The most important thing was to show the distinction between modes of transport powered by muscles and all others.

The process:


Chris

Data gathering:
I expected to see the influence of the pandemic in this week’s assignment. While I was collecting my transportation data (June 2020), the situation in Hong Kong seemed to be under control. New daily cases were in single-digits. Regardless, my wife and I remained cautious. We still tended to avoid mass transit and limited any unnecessary trips.

If things were normal, you’d see a lot more trips on my postcard. At least two daily trips via MTR (Hong Kong’s subway system) or a bus, occasionally a taxi. But now, I rarely venture into the city — and if I do, it’s mostly on foot.

Data drawing:
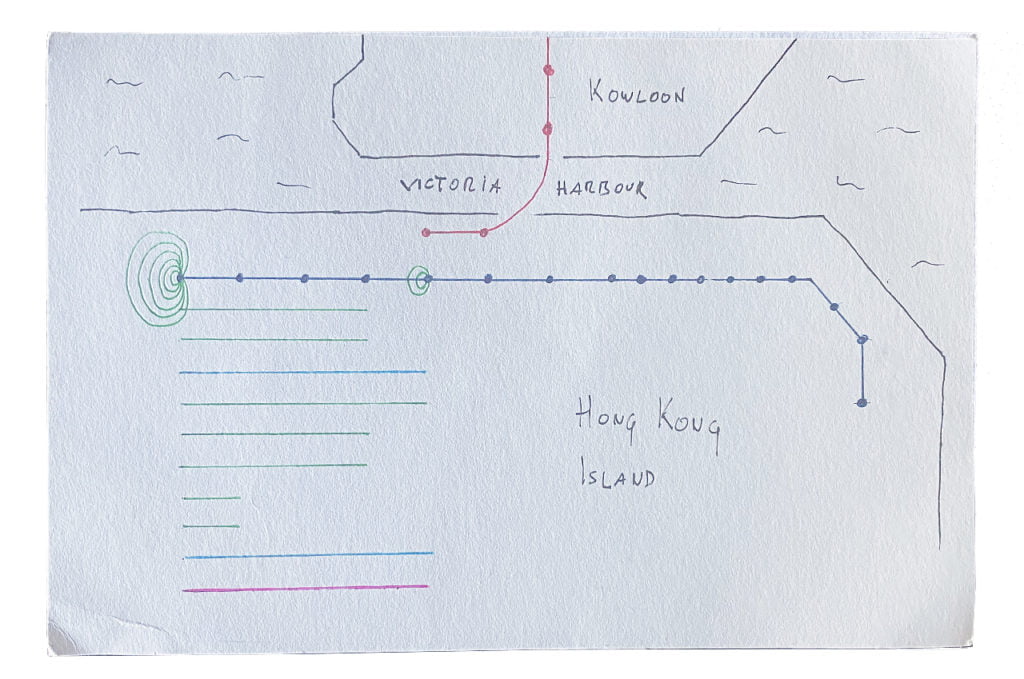
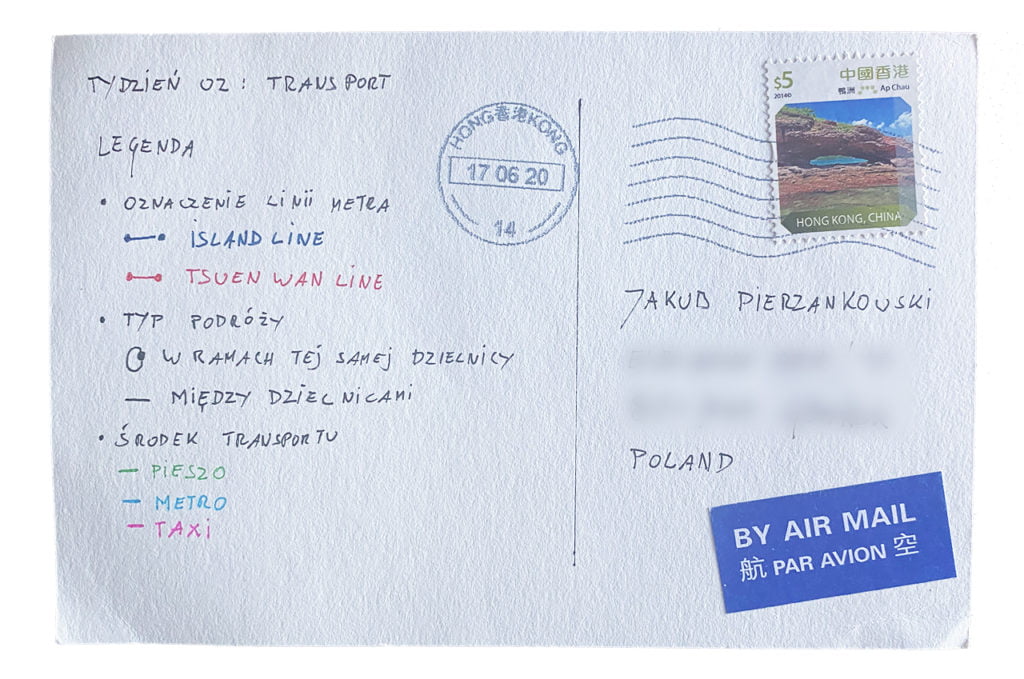
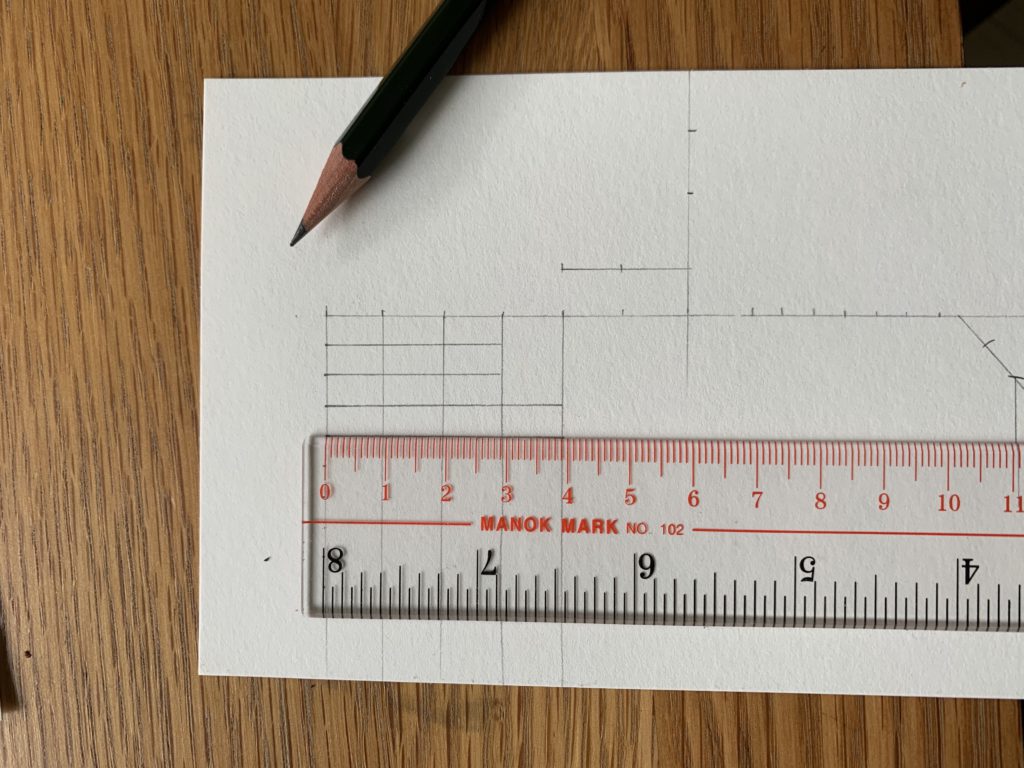
I had the idea to visualize my trips on the map of the MTR system. After all, vast majority of my trips follow the lines of the Island Line and Tsuen Wan Line. However, I underestimated the number of trips within my own district. The “western” part of the postcard seems heavy.

The proces:
Categories
Uncategorized

Week 01

Jakub

Topic:
It was our first week of the project and I was excited. However, I was careful not to become overzealous and burn myself out at the very first assignment. My approach was therefore simple: I just recorder every glance at the watch, along with the timestamp.

Data gathering:
Streamlining the collection of the data was key for me. I considered using a paper notebook at first, but ultimately taking screenshots on my phone turned out to work best. After all, I check the time on my phone most often. This approached turned out to be very convenient.

With every passing day, I had the tendency of looking at the clock less and less often. As soon as on the second day of the assignment, I learned to unlock my phone without glancing at the clock at the lock screen.

Data drawing:
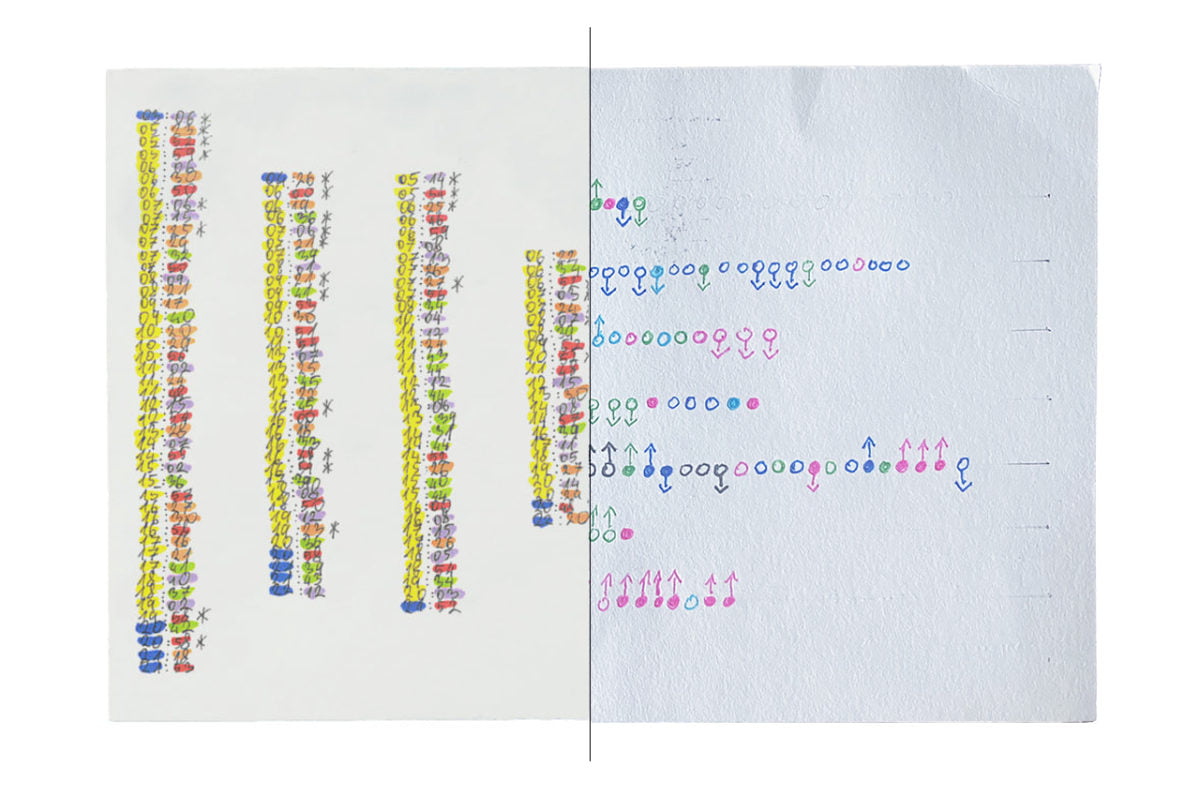
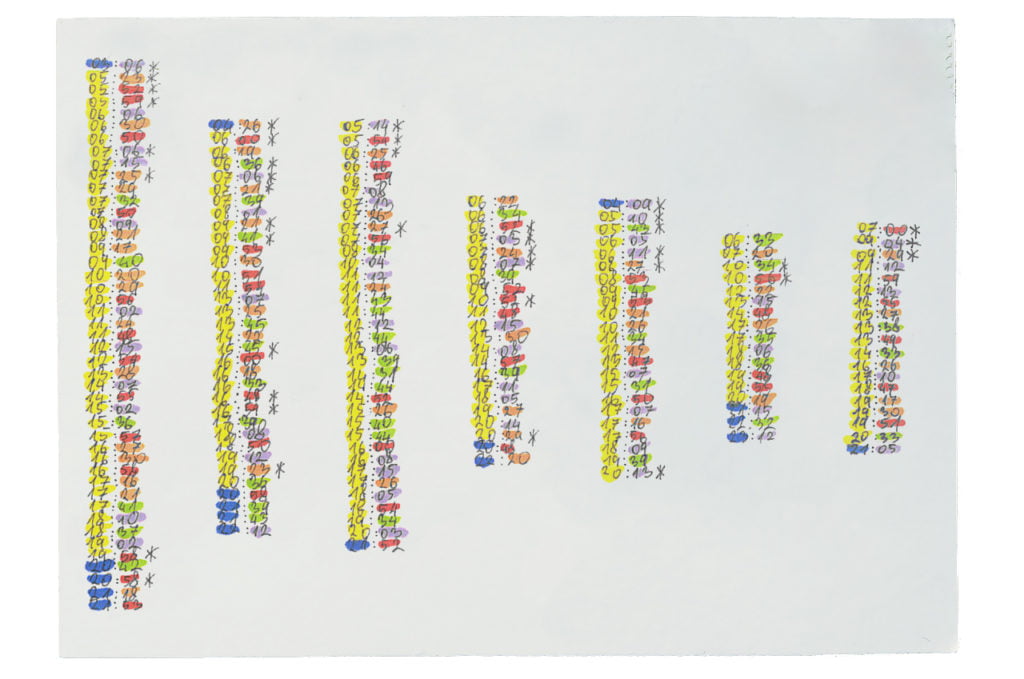
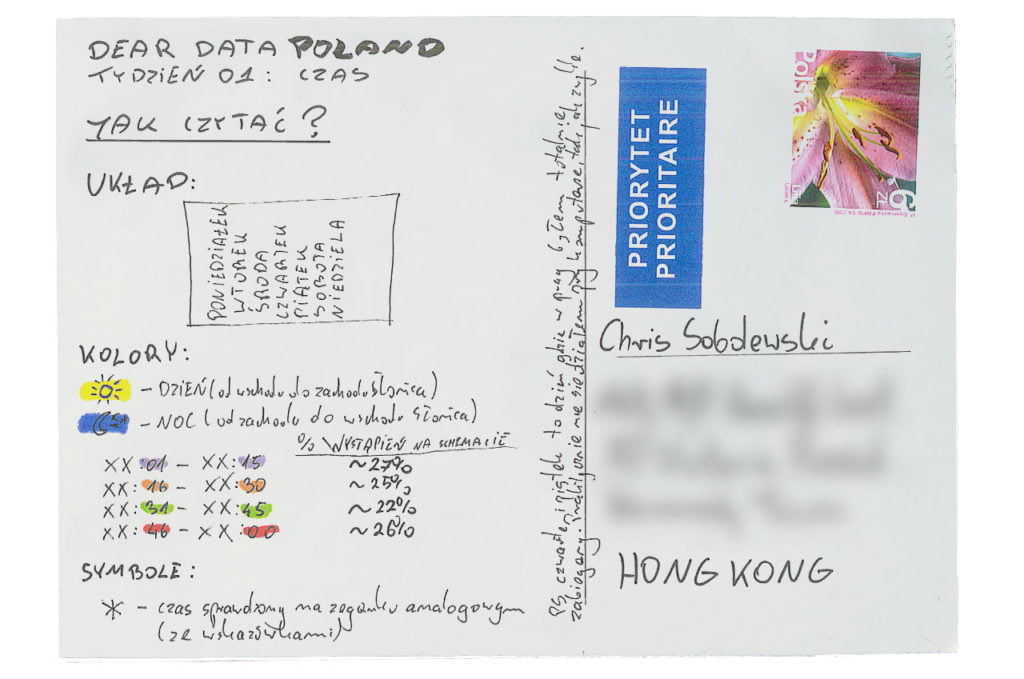
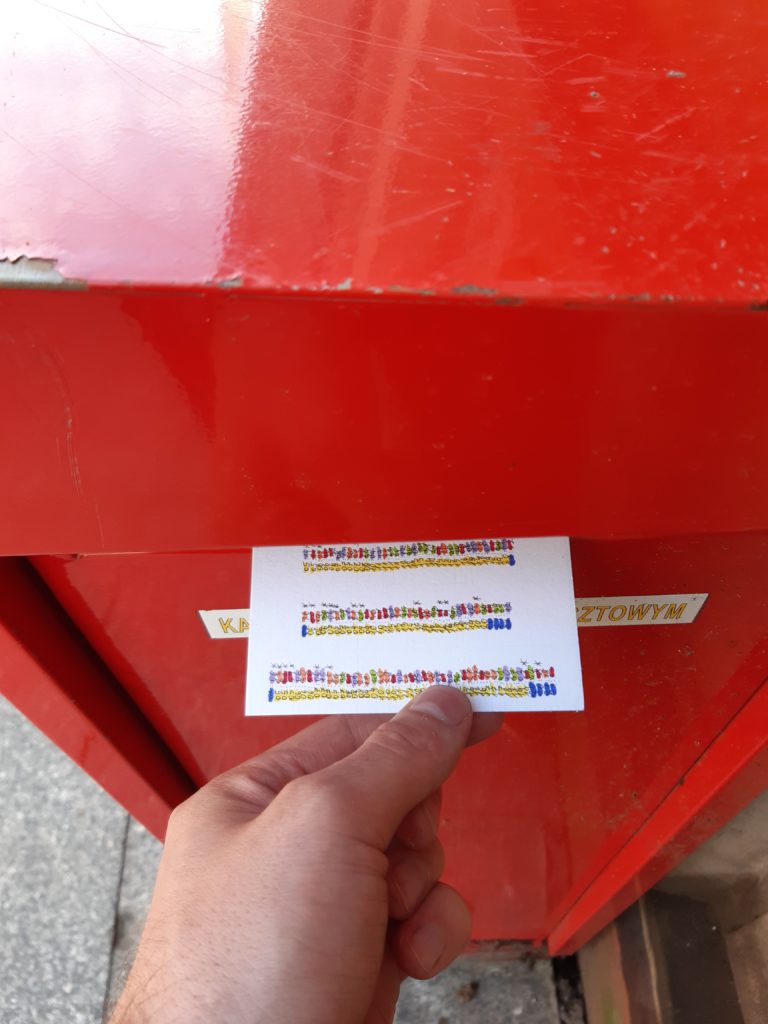
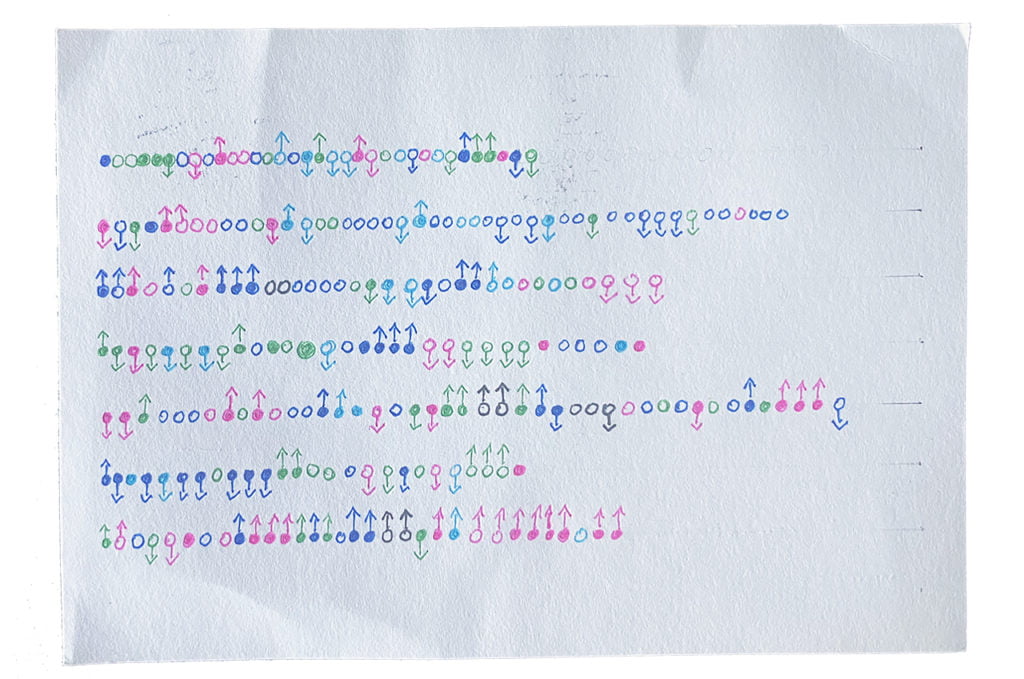
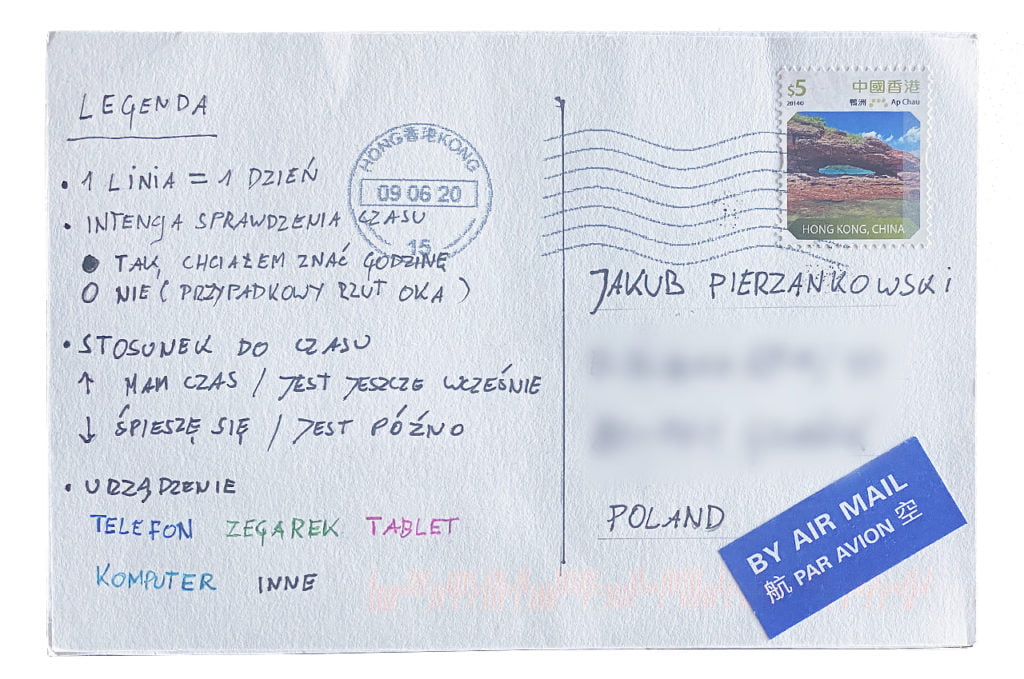
Drawing was a pleasure. From the very beginning I wanted my postcard to resemble the famous numeric paintings by Polish artist Roman Opałka. Ultimately, I had fewer data points than I’d expected and I pivoted to grouping the data into the days of the week. I think the readability of the viz benefitted from that approach.

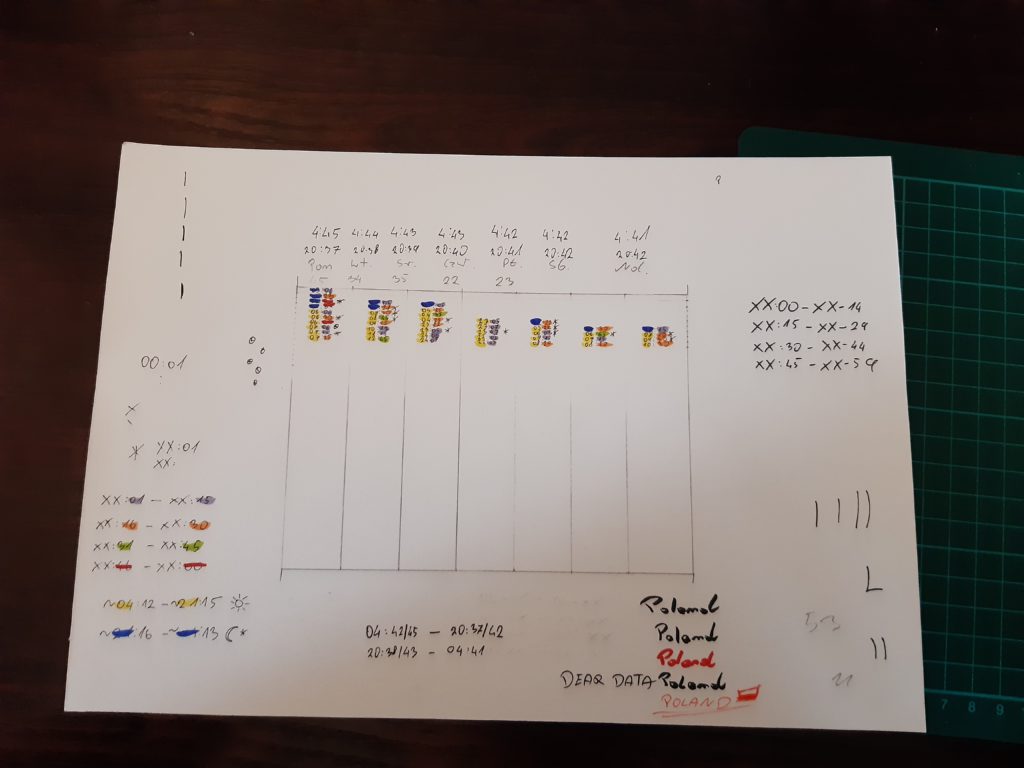
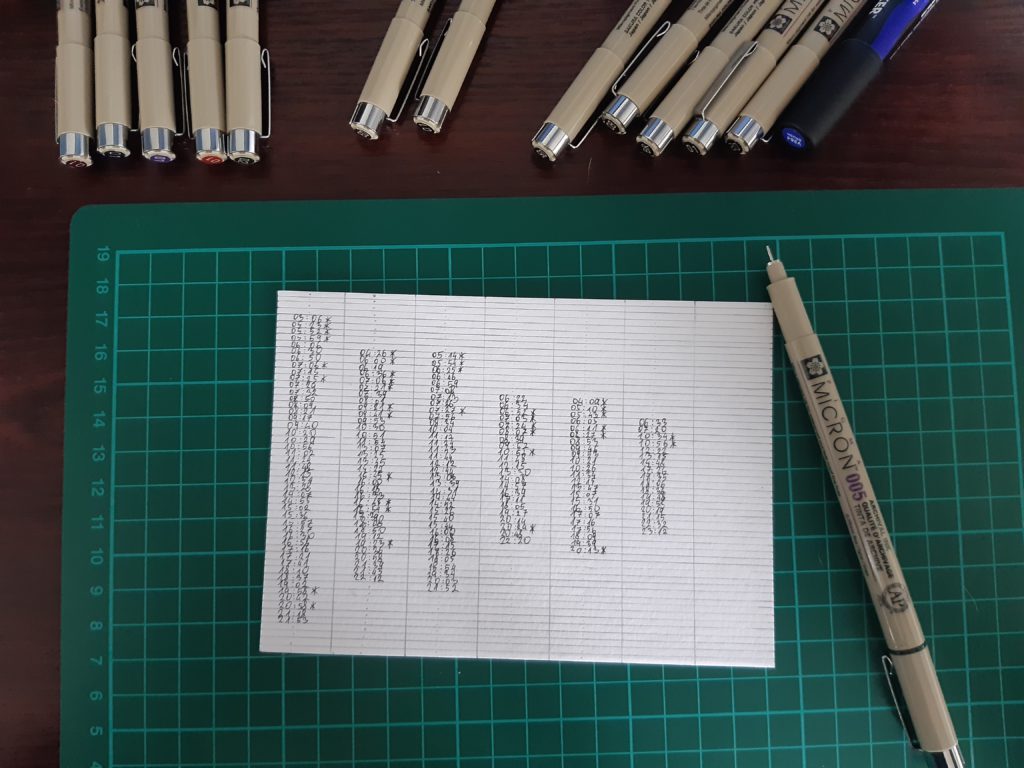
The process:


Chris

Topic:
Starting our project with a topic related to clocks and timekeeping turned out to be quite a challenge for me! Primarily because it generates a lot of data points.

Transitioning from collecting just very select data from my life (e.g. various health data collected via my Apple Watch; recording my expenses manually in Excel) to making a note of each and every single time I check the time — it was a big change.

It quickly occurred to me how often I check the time — and how many different clocks surround us: one on the wrist, another one on the phone, tablet, computer, taxi, clock towers, etc.

Also, this obligation to make note of every glance at my watch taught me to check time less often.

Data gathering:
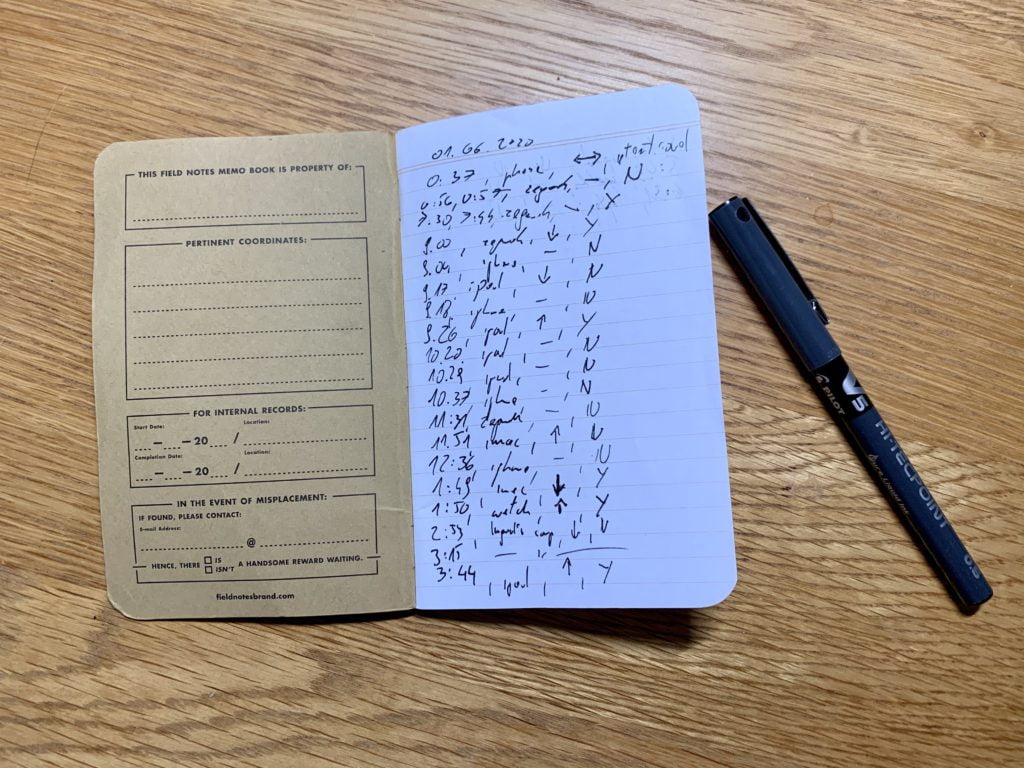
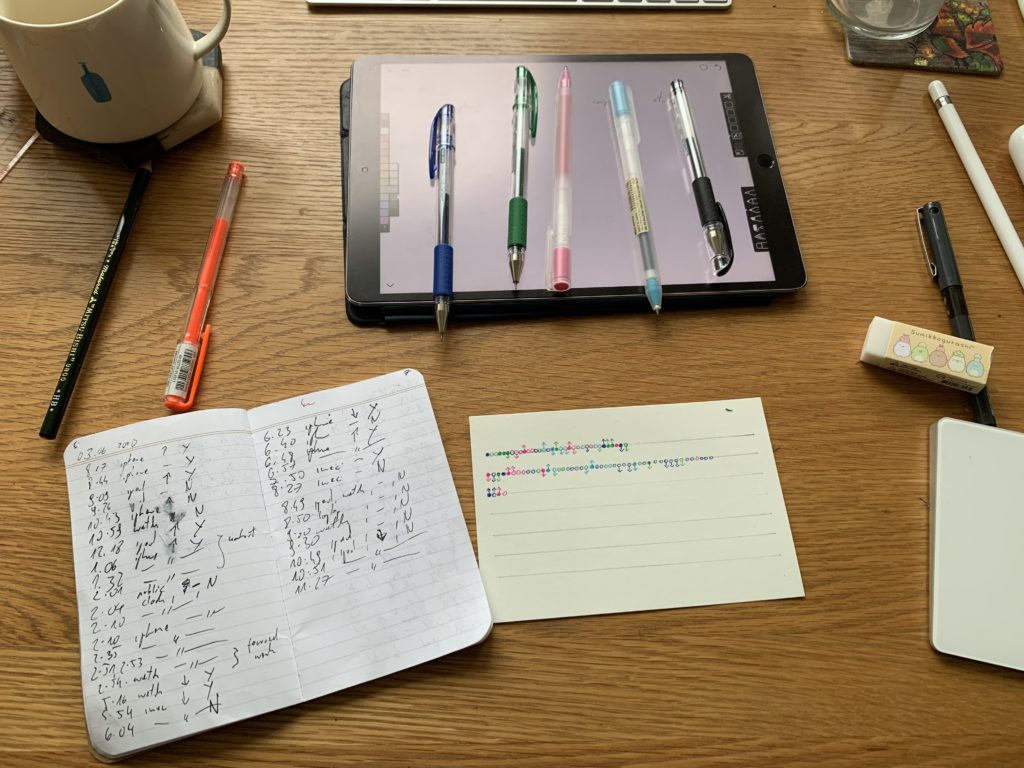
I decided to keep all my data points in good ol’ paper notebook. Using my iPhone for that purpose seemed troublesome — reaching for my phone, unlocking it with PIN-code (because FaceID won’t work with me having my face mask on), opening a dedicated app, finding the right file — a very discouraging ordeal. Especially, when repeated many times a day.

A paper notebook solves a lot of those problems. But it creates another — you need to remember to always keep it on you. Fortunately, I made it a habit very quickly.

Data drawing:
I dreaded the drawing part! I had doubts about my own creativity and drawing skills (or lack thereof). Somewhat surprisingly, I’m happy with how the first card turned out.

One thing I learned very quickly was that it helps to have a data viz in mind before you even start collecting the data.

The process: