Jakub
Topic:
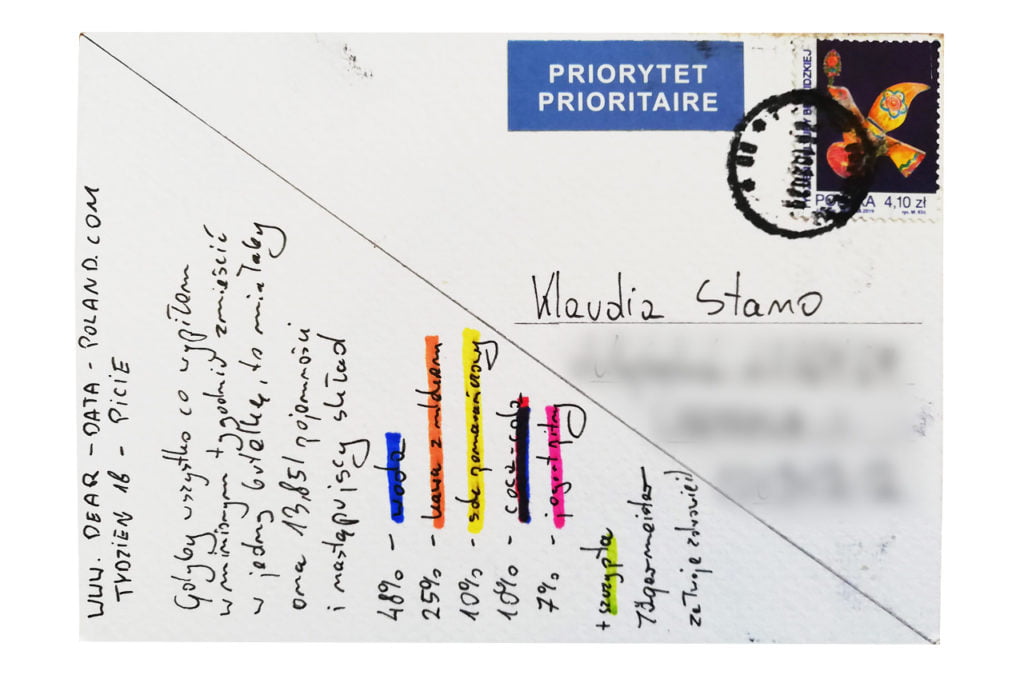
A few weeks ago I downloaded an app to count my daily water intake. The results were surprisingly bad. Even though I should drink around 2.5 liters of liquids per day, I sometimes struggled to drink even 1 liter. I used this app for 2-3 weeks and luckily managed to create a habit of drinking more water. This week was a perfect opportunity to test my habits and check if they are really permanent.
Data gathering:
This time I used a notebook, not an app. I enjoy hand-writing recently. Data collecting was not annoying at all and I am 100% sure I did not omit anything (which could have happened in the past with more complicated topics).
Data drawing:
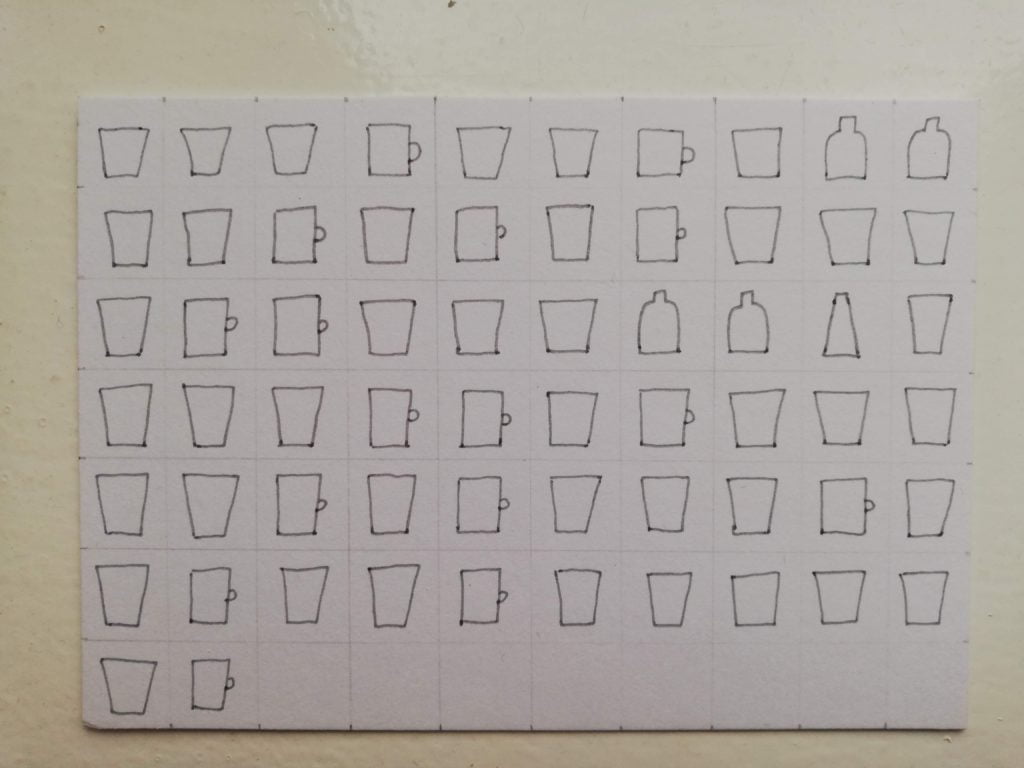
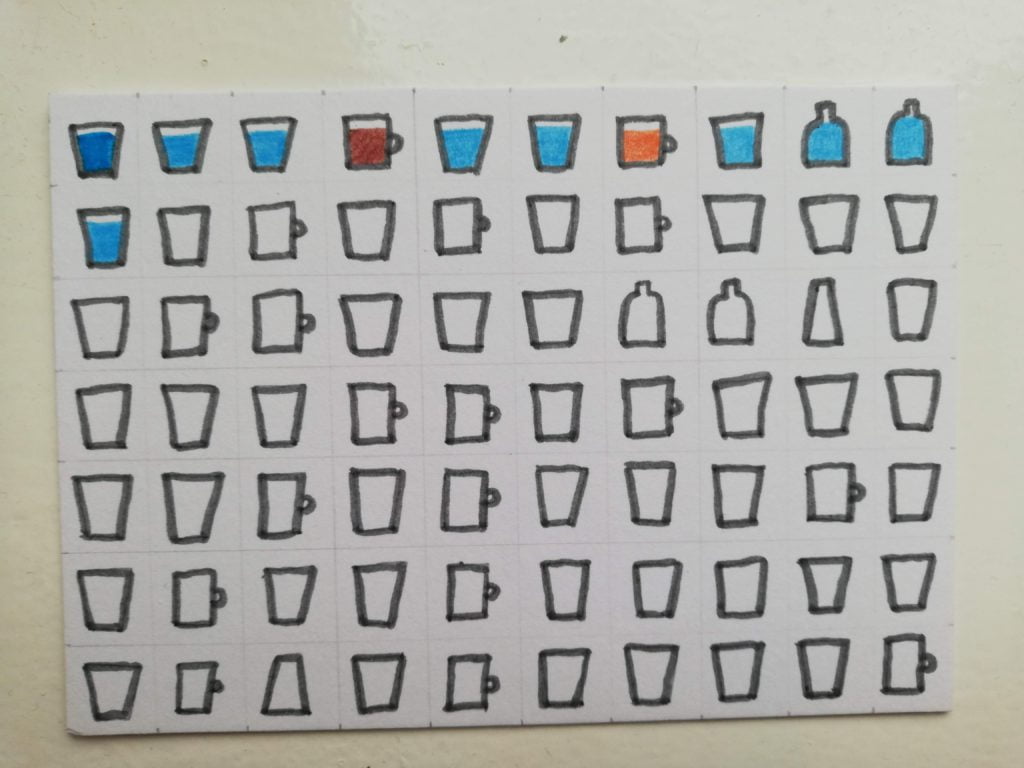
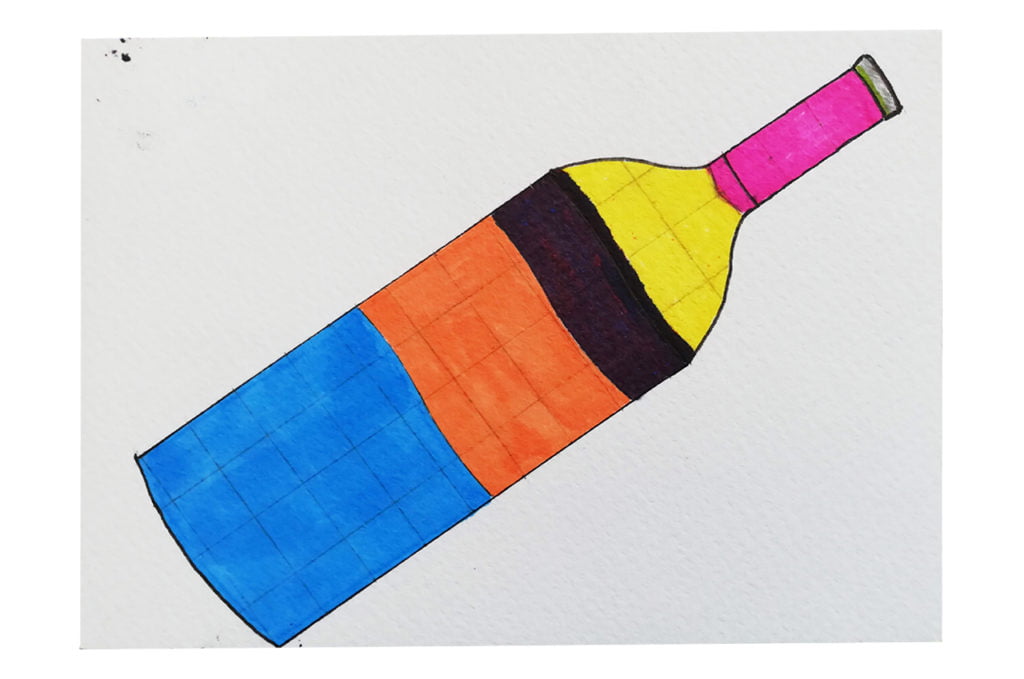
I am still looking for my “style” and I explore various data visualization techniques. Meanwhile I learn the basics of drawing. I also have to admit that creating postcards is very relaxing for me.
Klaudia’s postcard:
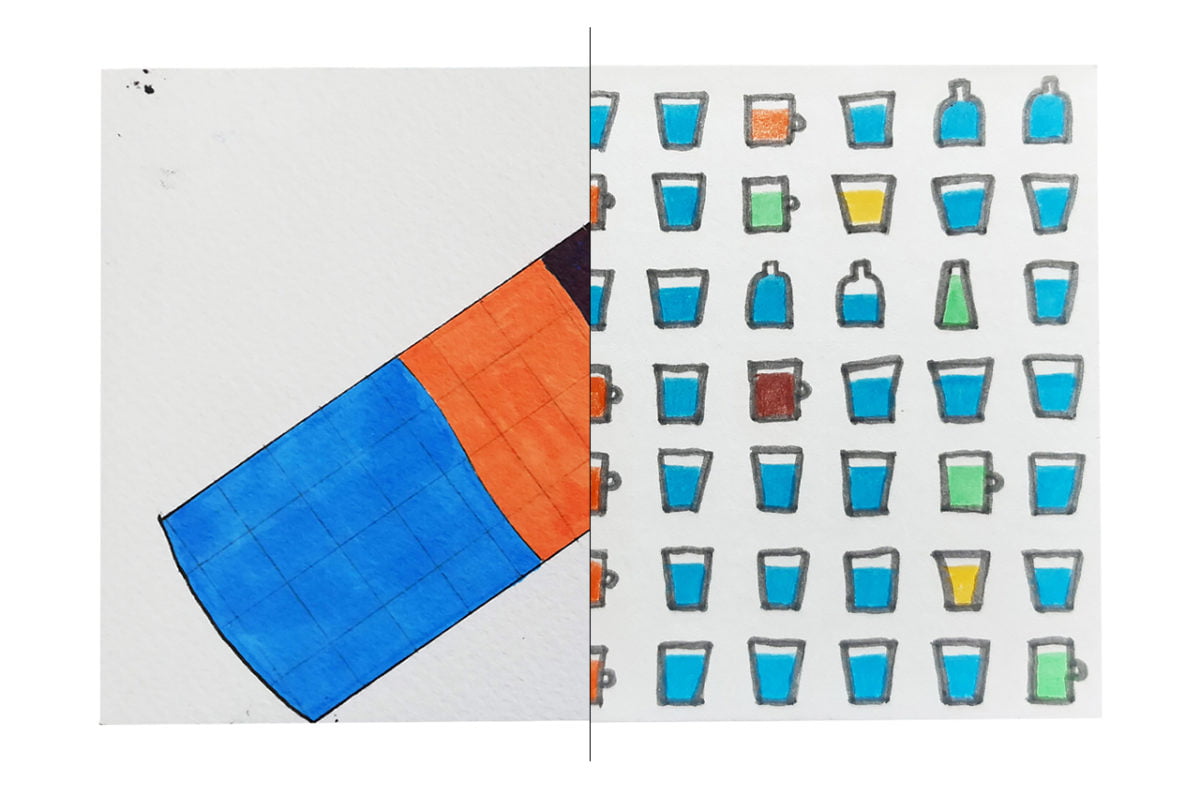
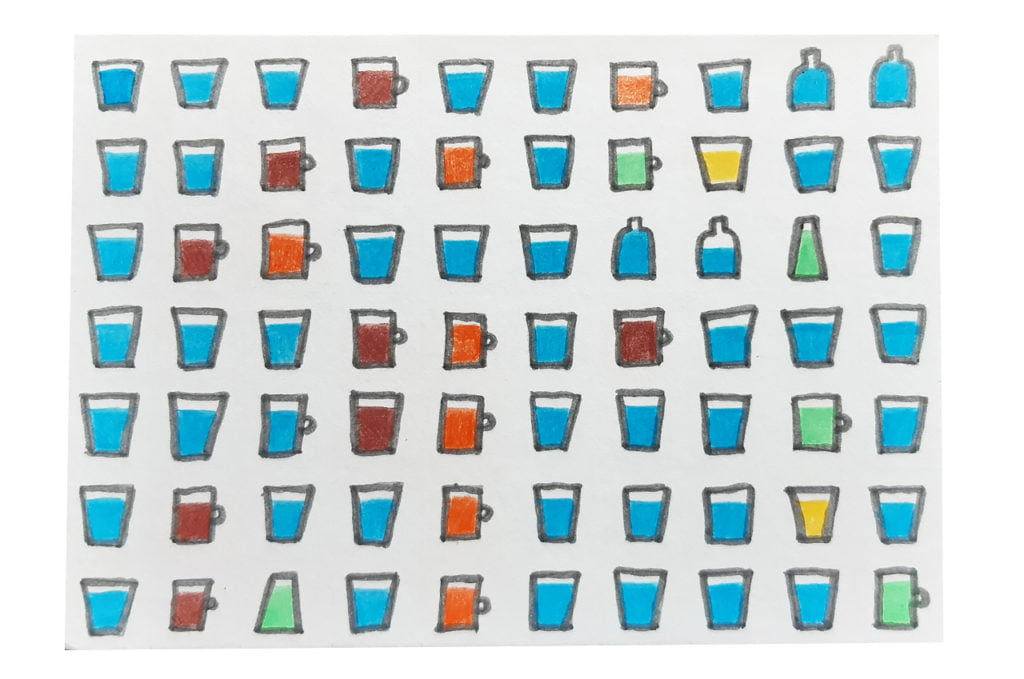
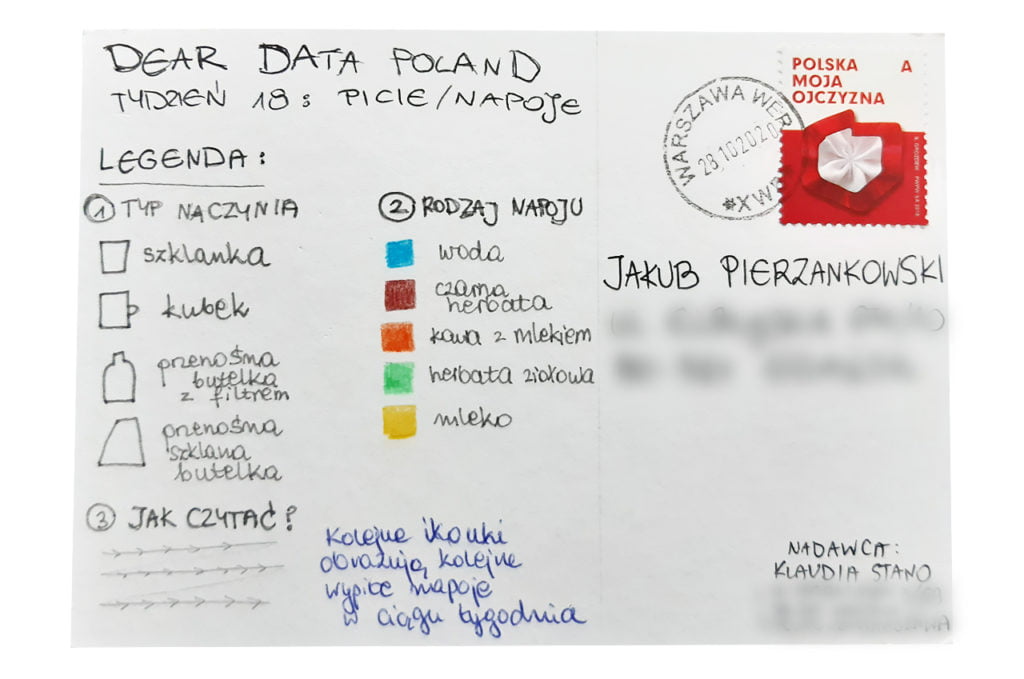
What I particularly like about Klaudia’s postcard is that she showed the various dish types she used. I regret that I have not thought about it before! It is an interesting additional data layer.
The process:
Klaudia
Topic:
This week’s “leitmotiv” is a bit less insightful for me than previous ones as I already know quite well my drinking habits. My staple drink is tap water (highly recommended in Warsaw!). I also enjoy tea and allow myself one coffee with milk and cinnamon per day.
I made, however, two discoveries. I have never before counted how much I drink on a daily basis. Now I know that the volume is between 1.7 and 2.5 liters of liquids per day (more on workout days). What I also noted is that I had only one sweet drink this week (tea with raspberry juice) and I am happy about it.
Data gathering:
During the week I was noting down all my drinks (and their order) on a piece of paper that I had always close at hand. I paid attention to the type of drink, dish type (glass/mug/bottle) and exact volume.
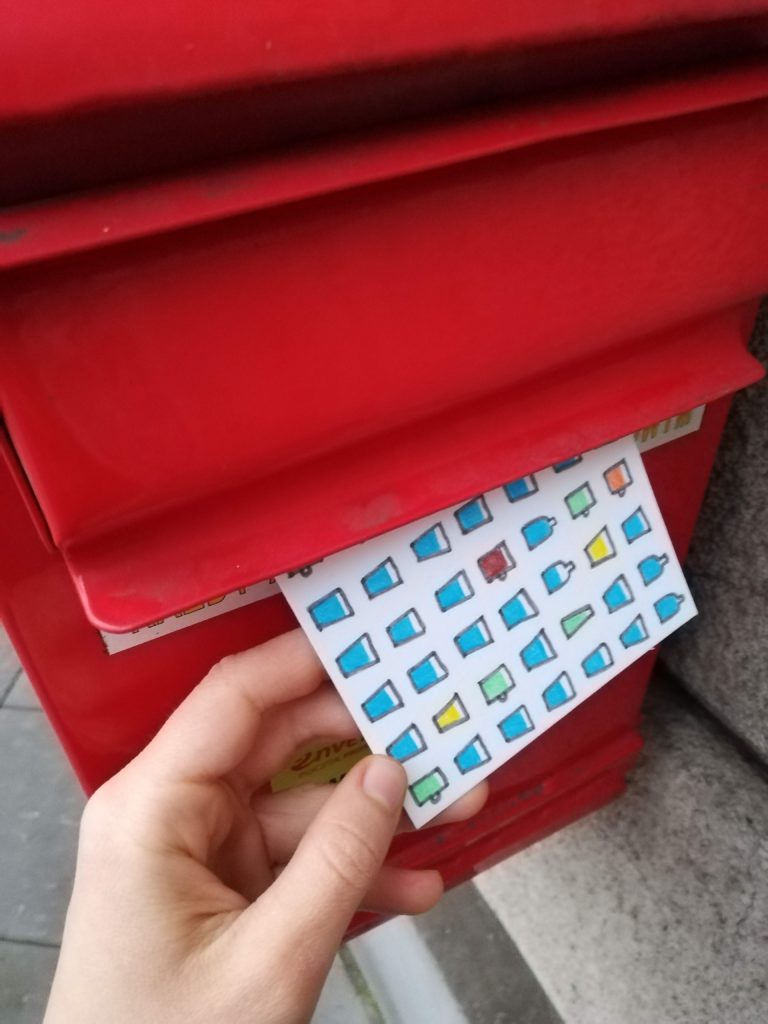
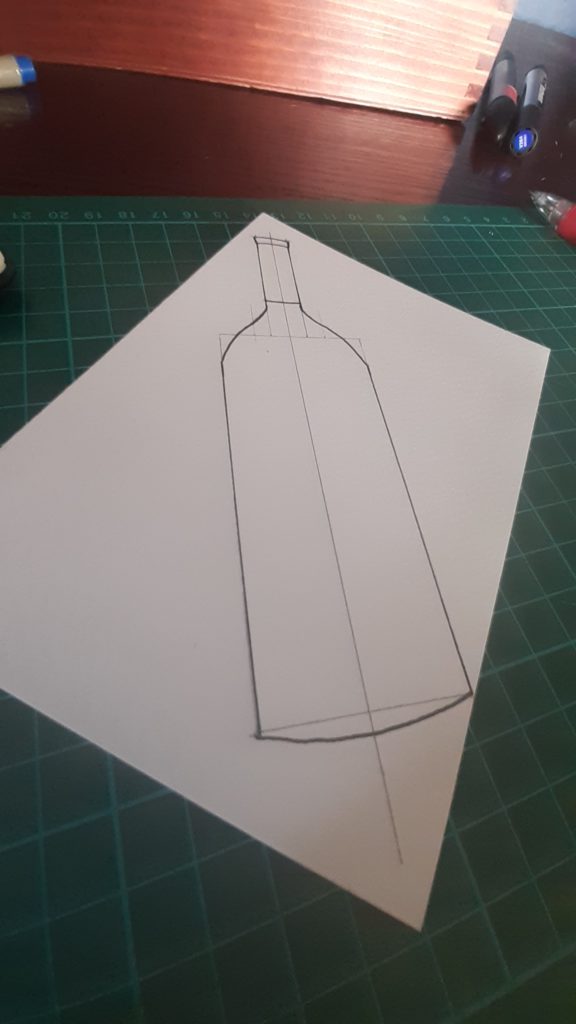
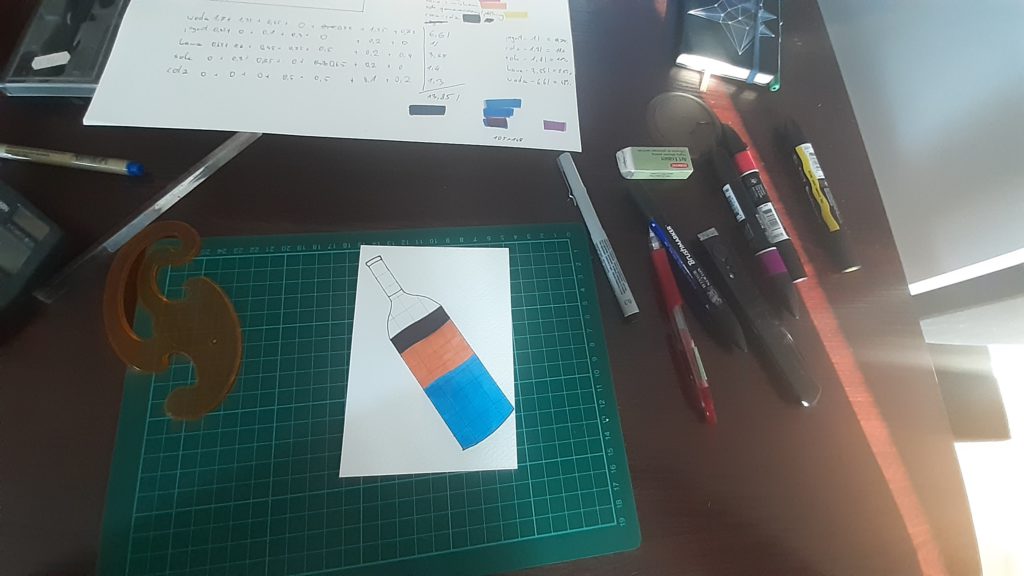
I had five or six different concepts. Some of them turned out to be misguided after initial sketches. As usual I was pondering different levels of data aggregation. Eventually I decided to draw all my drinks in their exact order. I am quite happy with the result!
Jakub’s postcard:
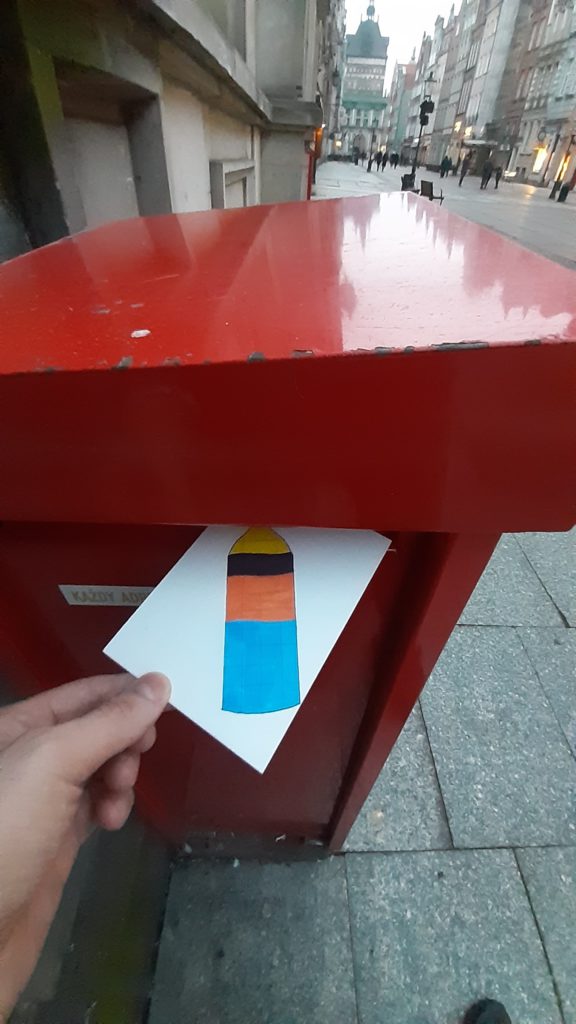
I really like Jakub’s postcard. I appreciate the mathematically correct proportions “inside the bottle” (from my experience this is sometimes overlooked, especially in media charts).
I also noticed that our weekly liquid intake was very similar – around 14 liters 🙂
The process:
