Jakub
The topic:
How often do we say the magic “thank you”? Has it lost its value? In this week of Dear Data Poland we were going to find out.
Data gathering:
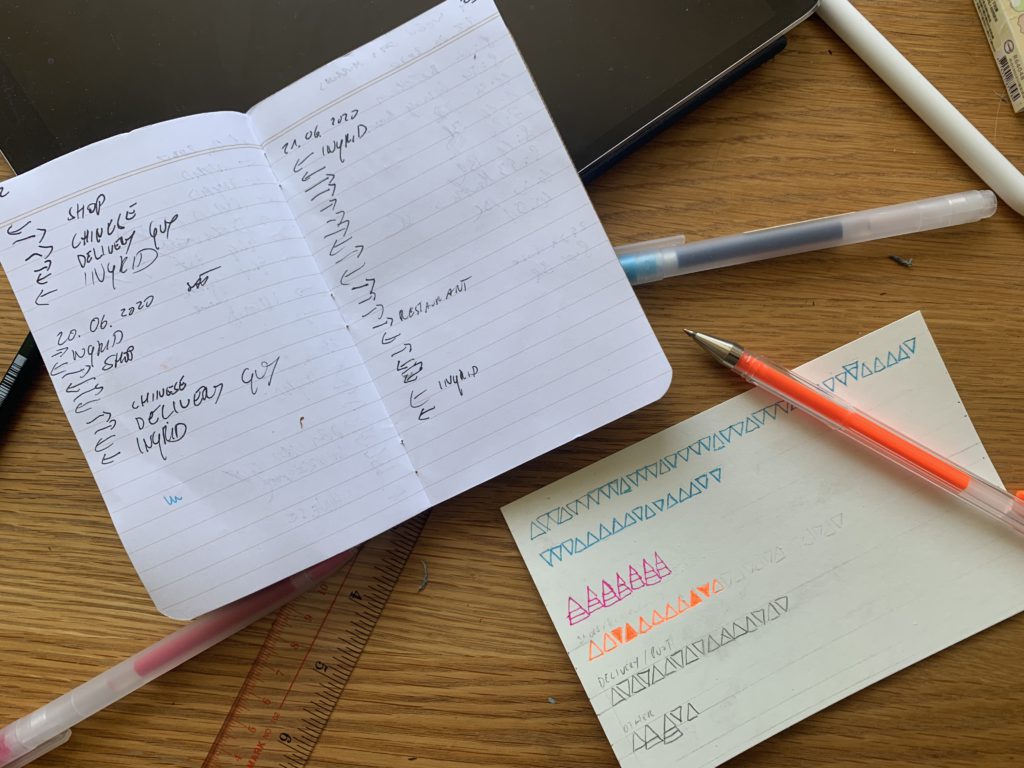
As usual, I wanted to streamline the data collection process and took notes and screenshots on my phone. It’s the easiest way of gathering data for me. I was making a note of the circumstances of each “thank you”, whether I was the recipient or the one thanking someone, as well as my relation to the other person.
Data drawing:
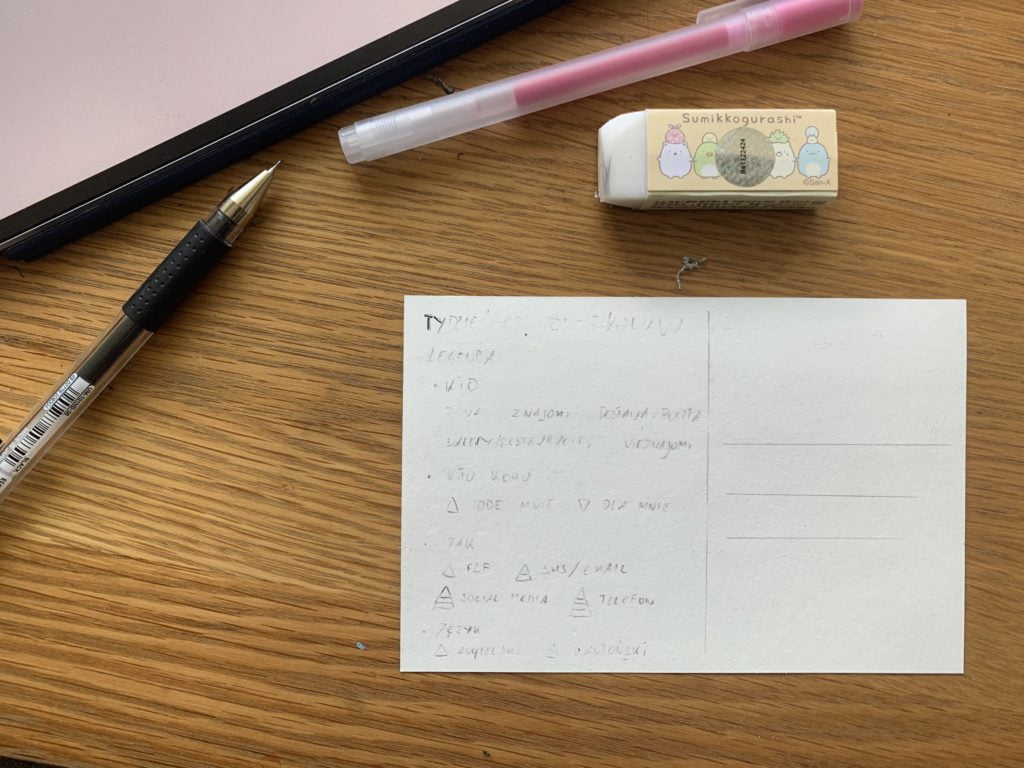
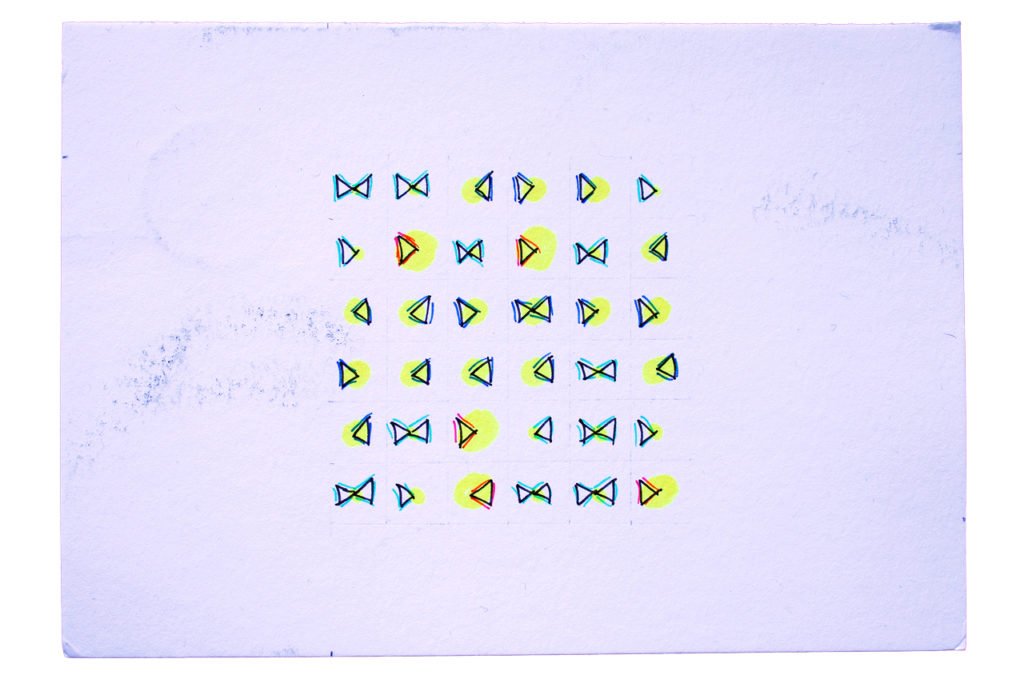
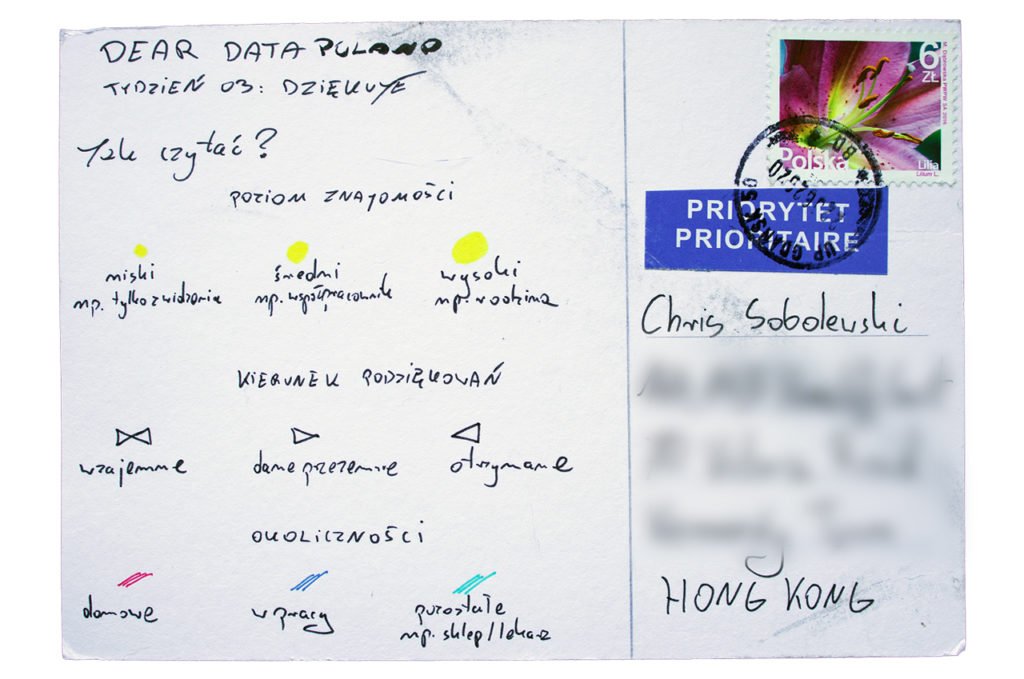
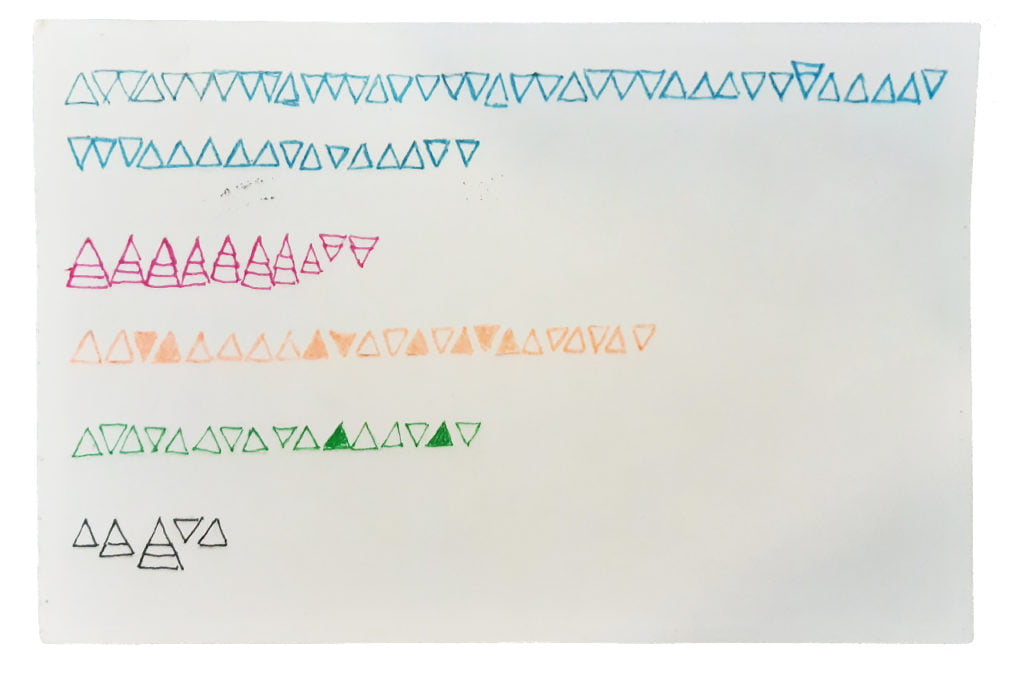
I was surprised by the relatively low number of “thank-you’s” I registered. 5 a day, on average. I wanted the postcard to highlight the imbalance between the “thank you’s” between people I’m close with, and the courteous “thank you’s”, for instance at a store.
The process:
Chris
The topic:
Collecting all the “thank-you’s” was definitely the one with a risk of observer bias. Am I acting differently just because I’m recording this data? Am I thankful enough?
Data gathering:
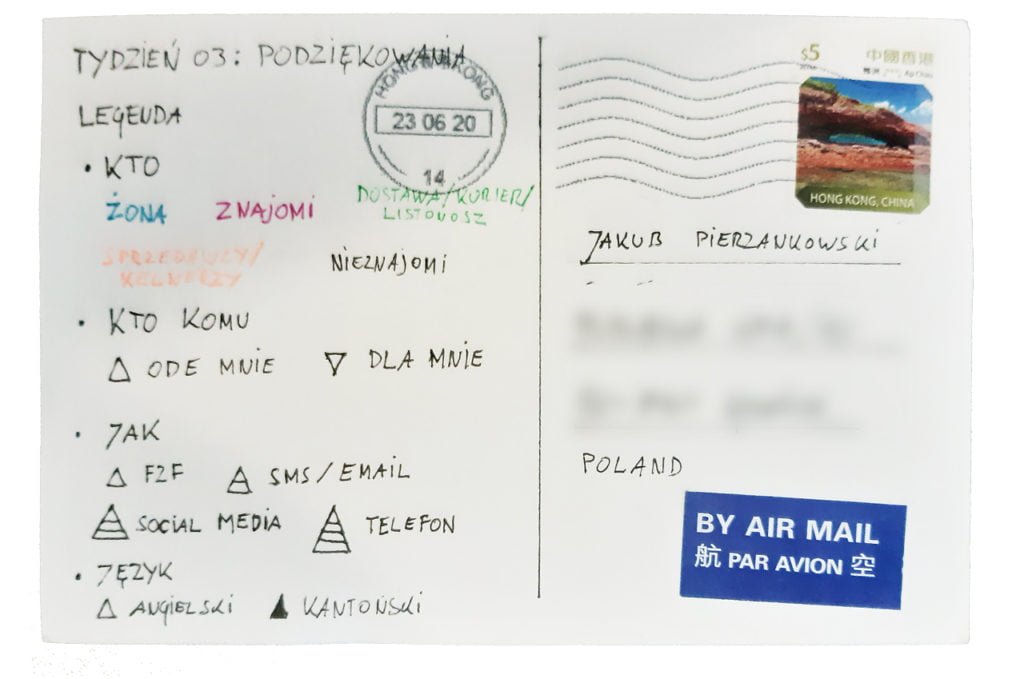
I recorded four data points for each thank-you:
- Who is saying the thank you
- Who is being thanked
- How did they thank — in person, via phone, via email, etc.
- In what language — for those rare instances where I said thank you in Cantonese
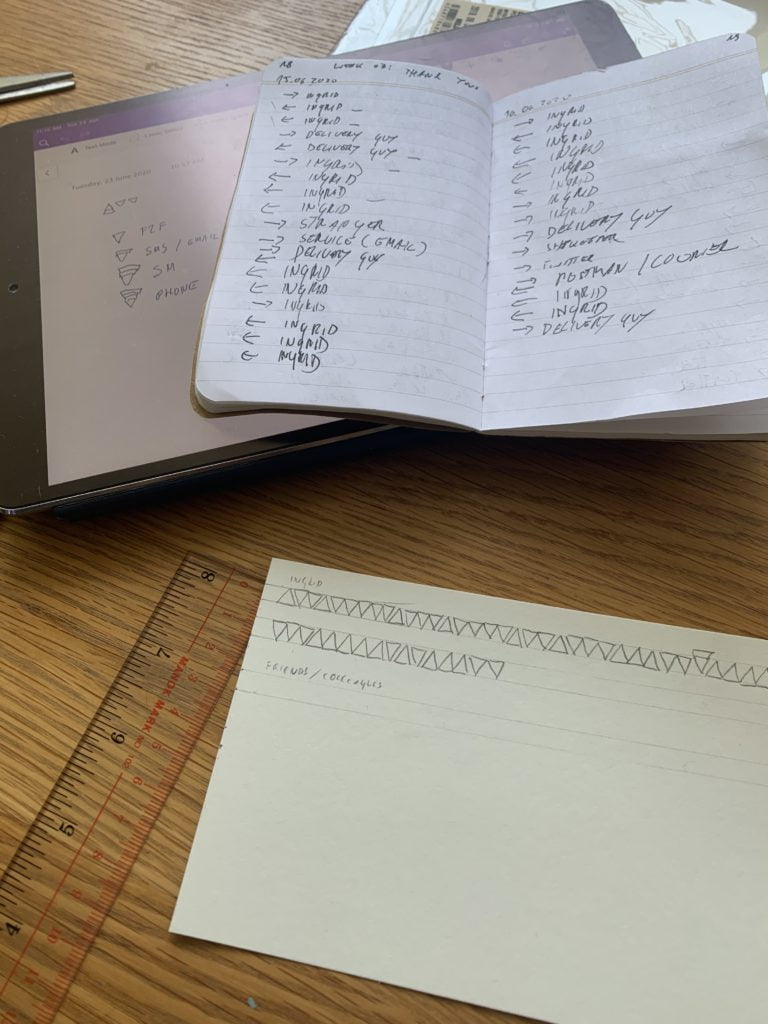
Making a note of each thank you turned out to be surprisingly difficult and distracting. Because sometimes you just say “thank you” in a conversation — and it’s hard to suddenly pause, take out your notebook, and start scribbling. So you need to keep that “thank you” data point in your memory — which is distracting you from the conversation that is still ongoing.
Data drawing:
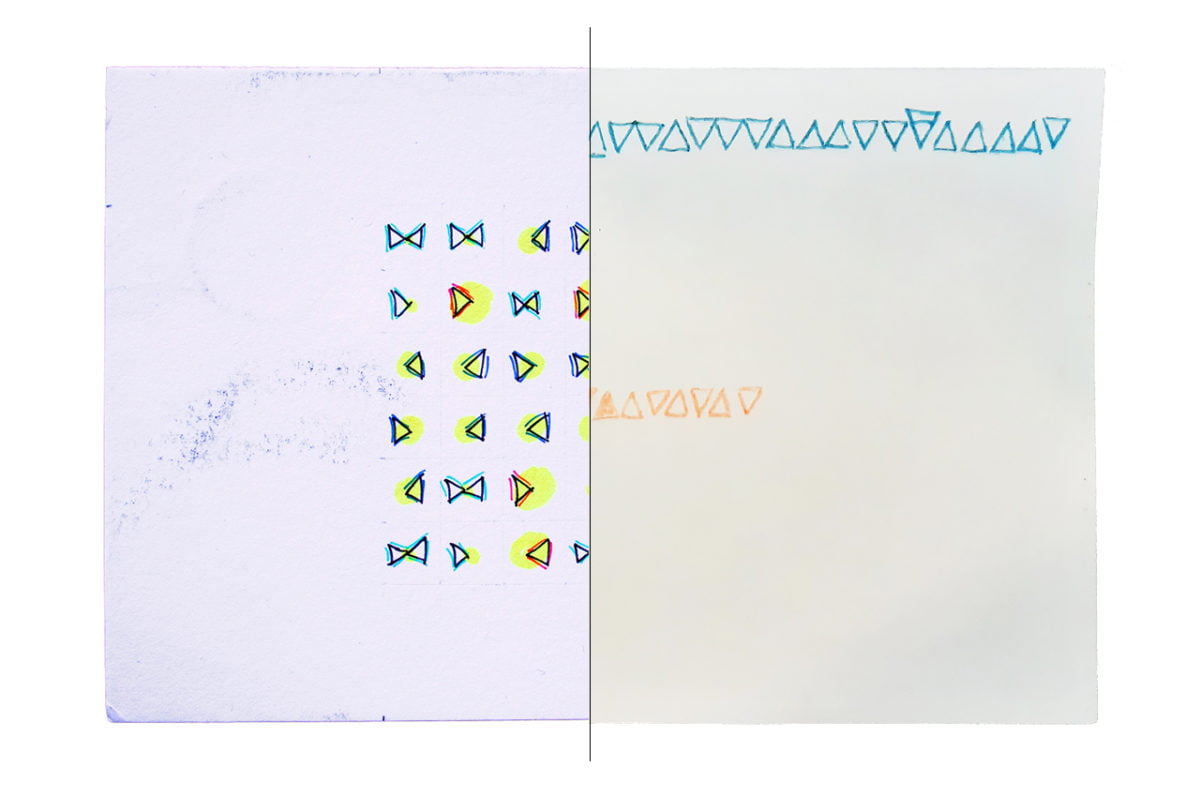
For this postcard, my “charts” were ordered by people whom I thanked or who thanked me.
The end result is not too bad, though I had a bit of a difficulty with the “how” part of the thank you. Size of some triangles on the postcard went out of control!
The process:
