Jakub
Topic:
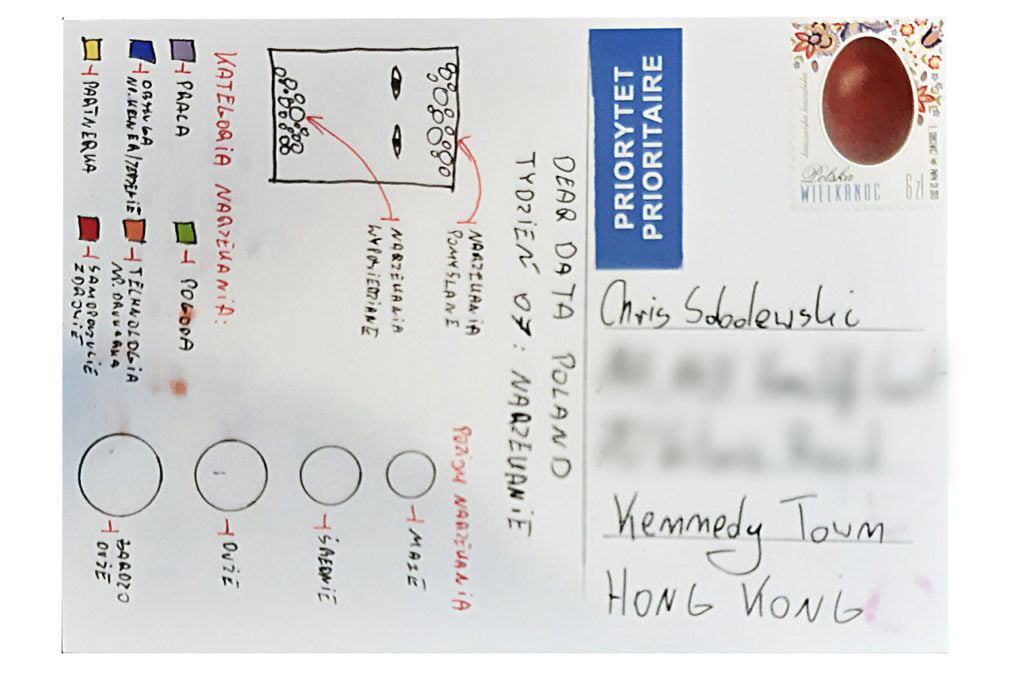
Some say Polish people have complaining in their DNA. So this was a good opportunity to verify that. People consider me an optimist — but am I one really?
Data gathering:
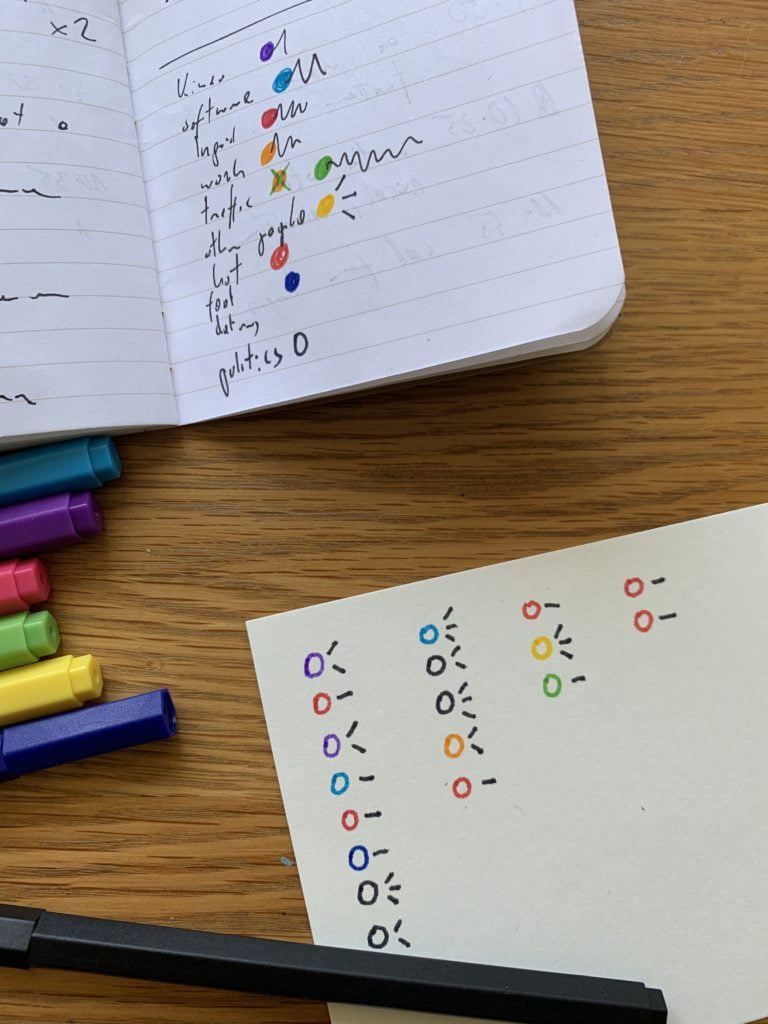
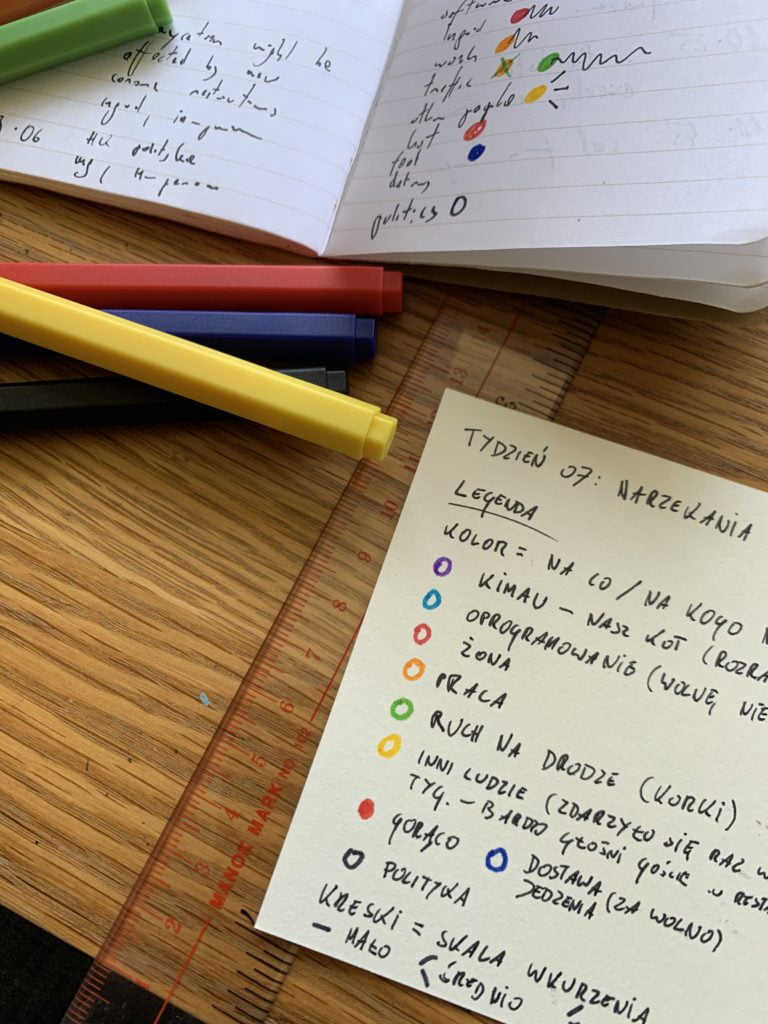
As usual, I was using notes app in my smartphone to collect the data. I was writing down every complaint — regardless of wether I spoke it out loud or just thought of it. After all, we’re not always ready to share our complaints. Especially at work.
Data drawing:
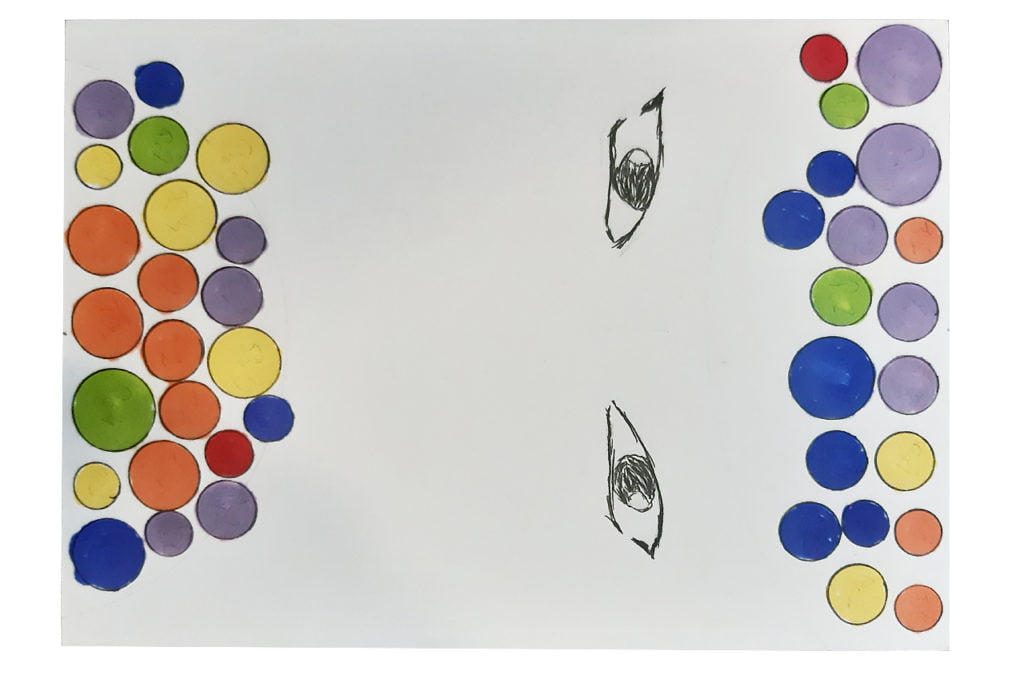
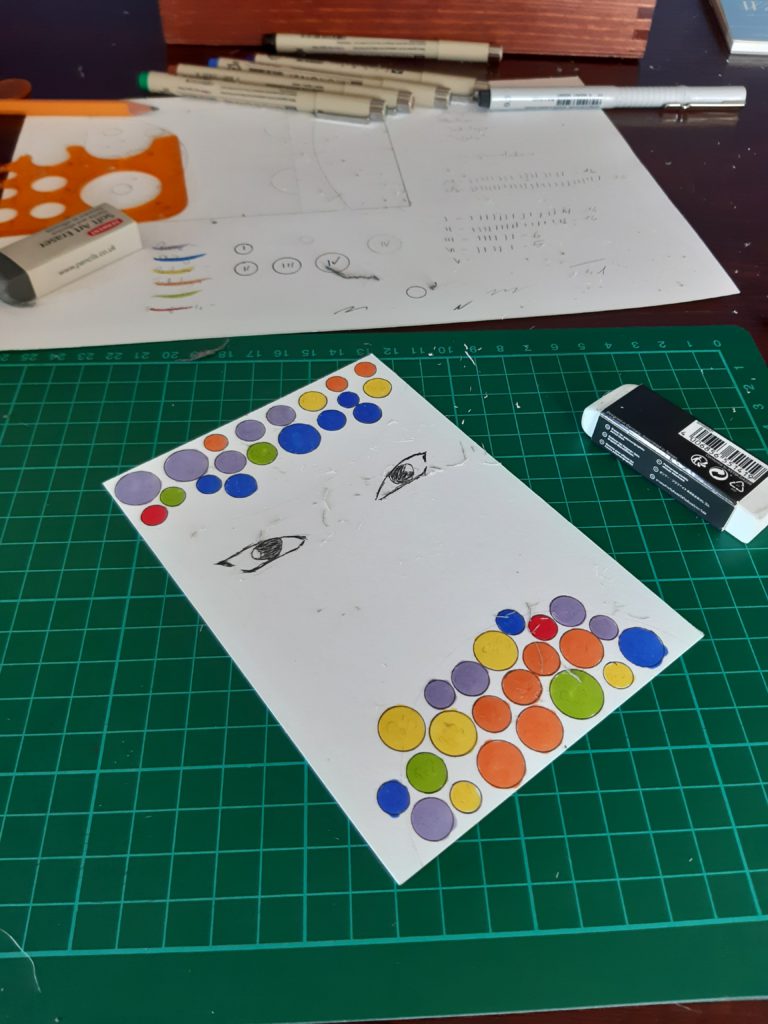
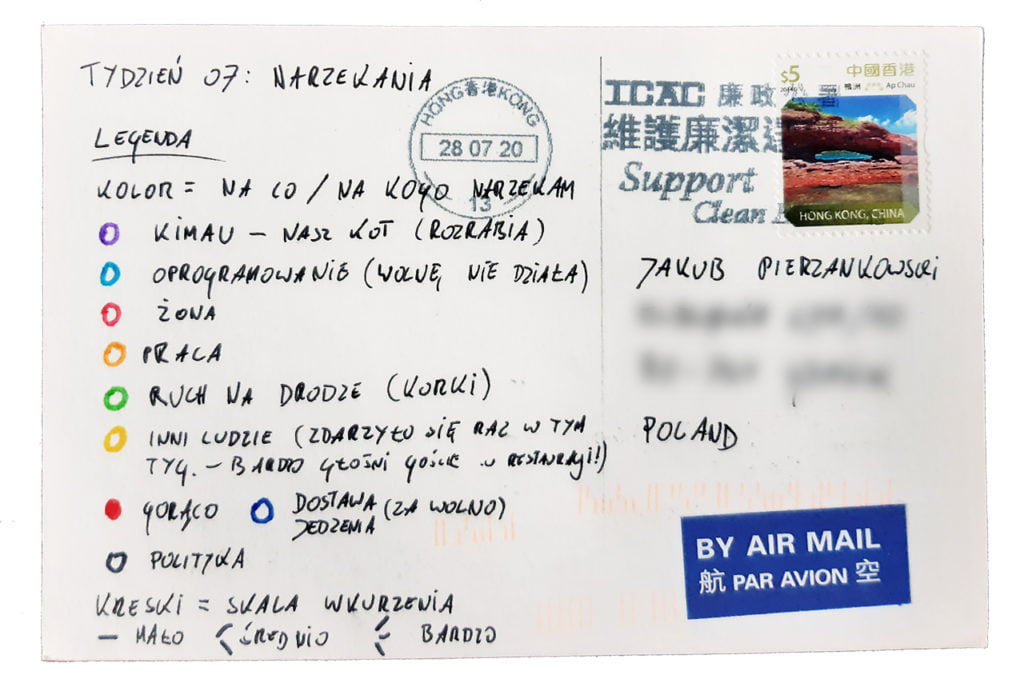
I wanted to compare the spoken out complaints against those I kept only to myself. It occurred to me, that using a drawing of a face to show that could be a good idea. Hence the eyes.
The process:
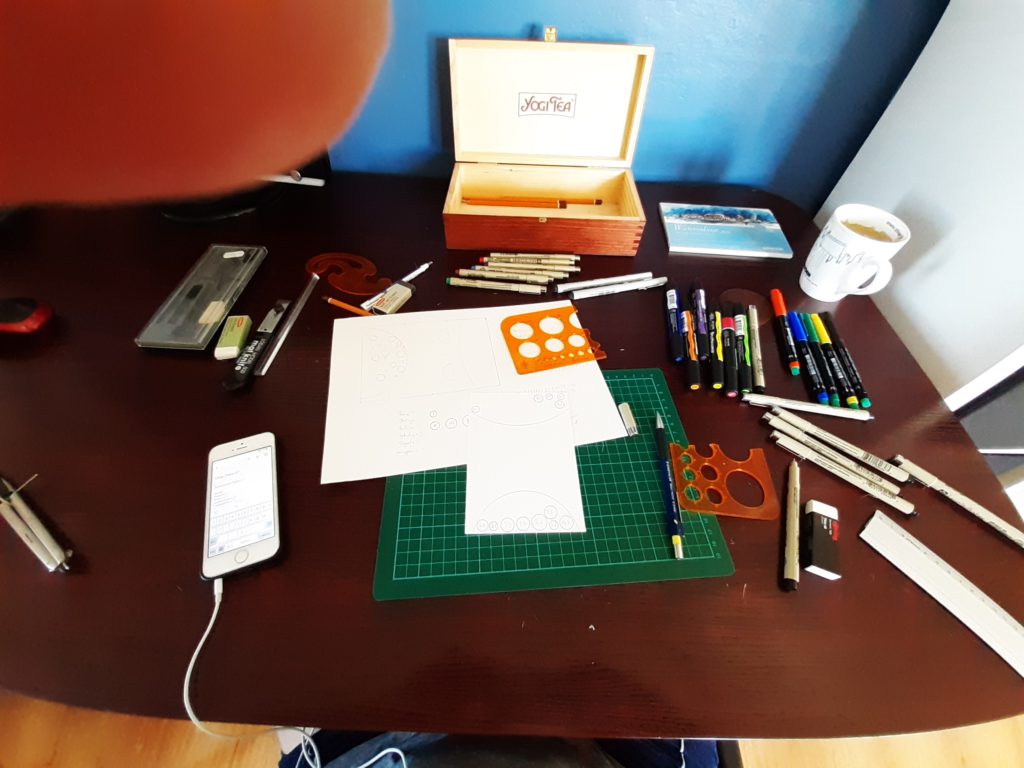
Chris
Topic:
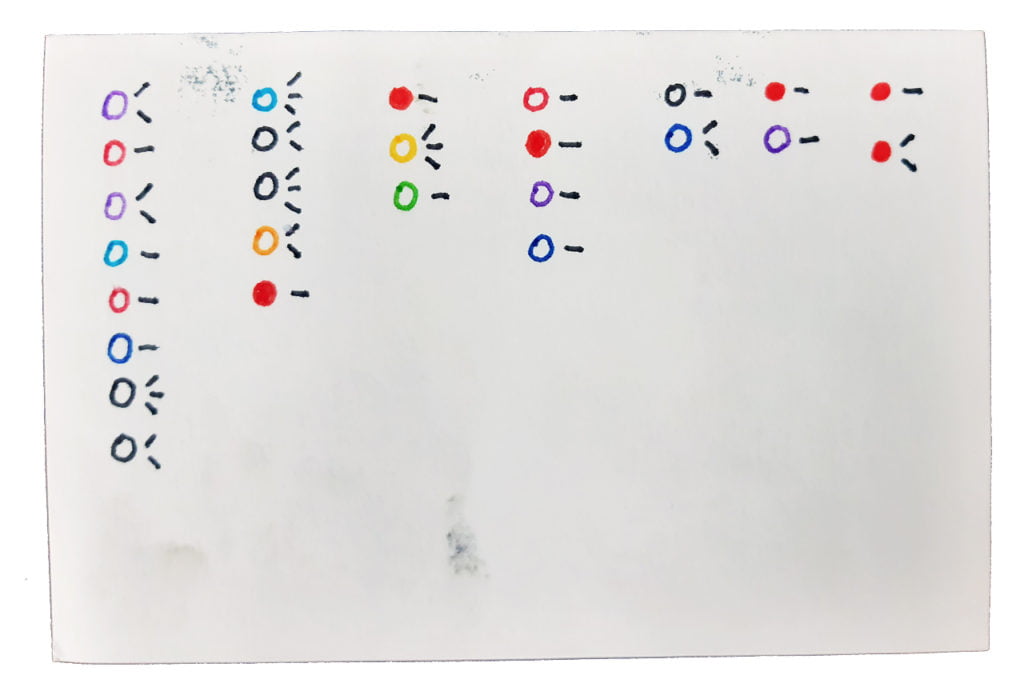
This one was unusual. Quickly I found out that the data I’m gathering are more of a qualitative than quantitative kind.
When it came to drawing, it reminded me of one of the most dreaded and mundane tasks of every market researcher — coding open ended responses.
Data drawing:
It was the first time I didn’t use a pencil outline for my postcard. Hashtag “courage” 😉. And I got a new set of drawing tools too!
Conclusions:
It’s clear — the closer to the weekend, the fewer the complaints. Mondays, obviously, are the worst!
The process:
